
Team and till reports
Last updated: 6 November 2026 · 4 min read
These reports show how each person and each till did, when your shop is busy, and who changed what. Use them to check cashiers at closing time, work out commission, and answer the question "who did this?". Sales by person is under Selling, Till sessions and Sales by hour and day are under Daily, and Audit Trail is under More reports.
Before you start: Audit Trail is only for the owner and admins. Sales by person and Till sessions need their own permissions, so a cashier may not see them. See Roles and permissions.
Sales representative#
Reports > Selling > Sales by person shows the sales, commission and expenses of each person. The page is called Salesperson Performance.
- Choose the Date Range and a Business Location. Use Person (1) to look at one person, or leave it on Everyone.
- Read the cards: Net sales (before tax, after discounts, less returns), Commission (2), Expenses and Due on their sales, which is the amount customers still owe on those sales.
- In the table, each person shows the Invoices, Net sales, Collected (money received in the dates chosen), Commission and Expenses. The last row is the total.
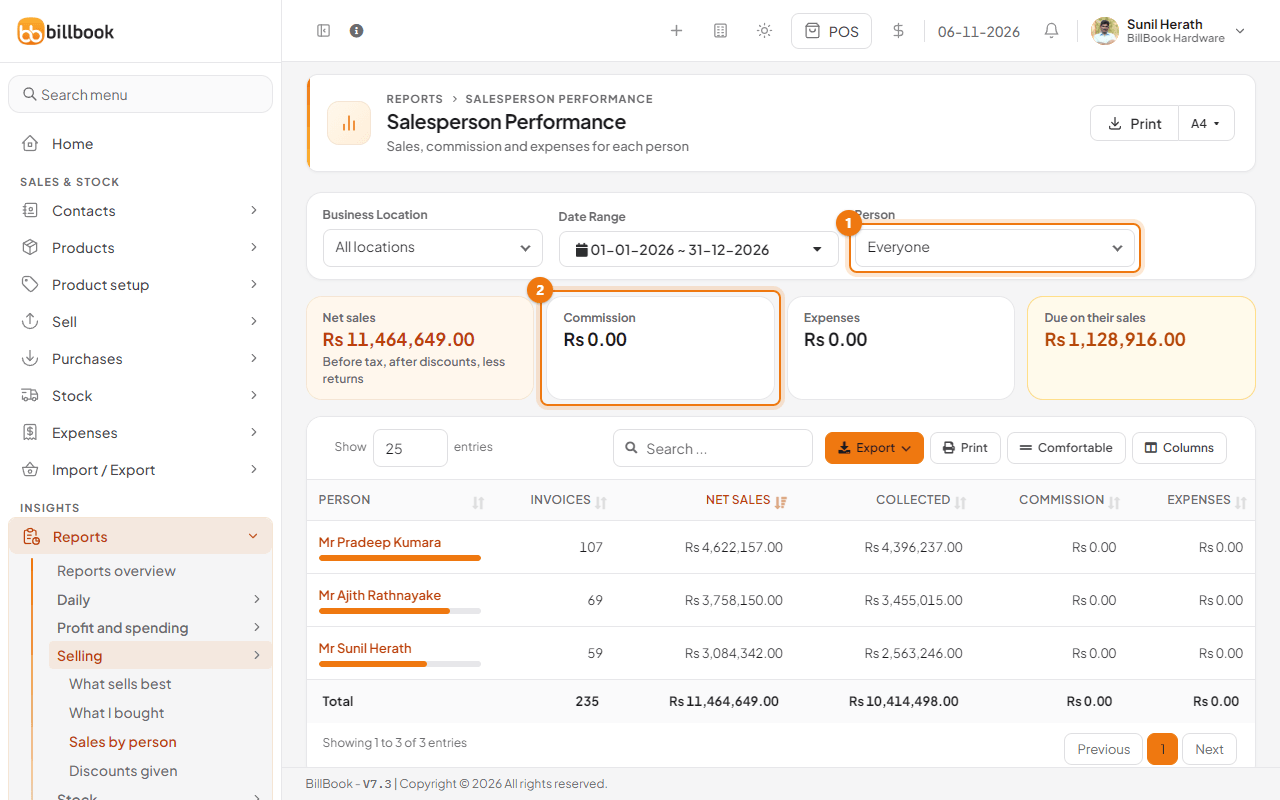
Sales and invoices are the final sales each person added in the dates chosen. Commission is worked out on the sales where the person is the commission agent. To set up agents and their percentage, see Sales commission agents.
Register report#
Reports > Daily > Till sessions lists every till session, from the day the cashier opened the register to the day it was closed. The page is called Counter Shift Report.
- Choose the Opened between dates, a Business Location and a User. Use Status (1) to see only Open or Close sessions.
- Read the cards: the number of Sessions, Total takings (2) across all payment methods less refunds, Refunds, and the Cash difference, which is the cash counted less the cash expected on closed sessions.
- In the table, each session shows the open and close time, the user, Opening cash, the Cash and Card taken, Takings, Paid out, Expected cash, the amount Counted and the Difference. A session that is not closed shows Still open.
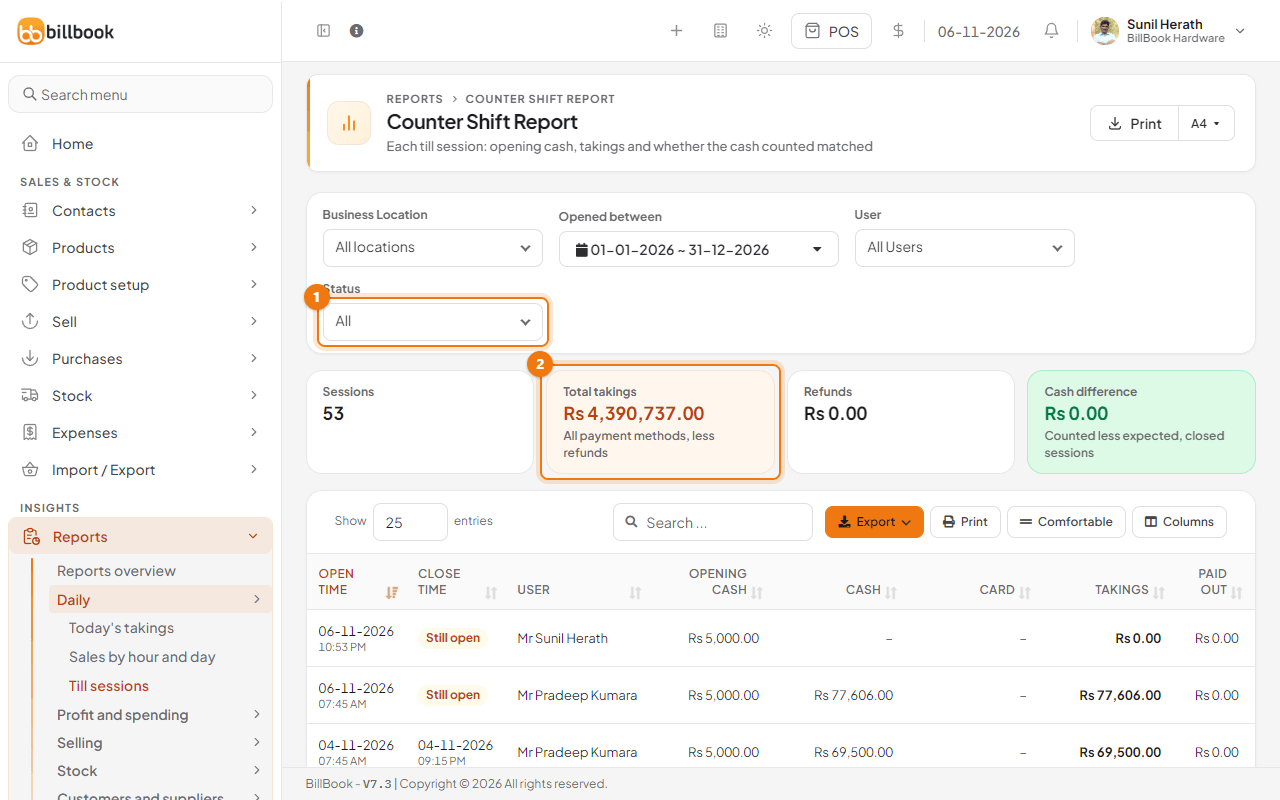
Note: The table has many columns and is wider than the screen. Scroll it sideways, or use Columns to hide the columns you do not need.
Select View on a row to see the takings and closing notes of that session. To open and close a till, see Cash register: open and close. The Day-End Report (Z Report) also lists the sessions of the day; see Money reports.
Sales by hour and day#
Reports > Daily > Sales by hour and day shows when your shop is busy, so you can plan who works when.
- Choose the From and To dates (it opens on the last 30 days), a Business Location and, if you want, a Cashier (1). Select Show.
- Read the cards: the Busiest hour, the Busiest weekday and the Best cashier, each with its number of invoices.
- Choose By hour, By weekday (2) or By cashier to change the table. Each row shows the invoices, net sales, the average invoice and its share of the total. The busiest row is marked Busiest.
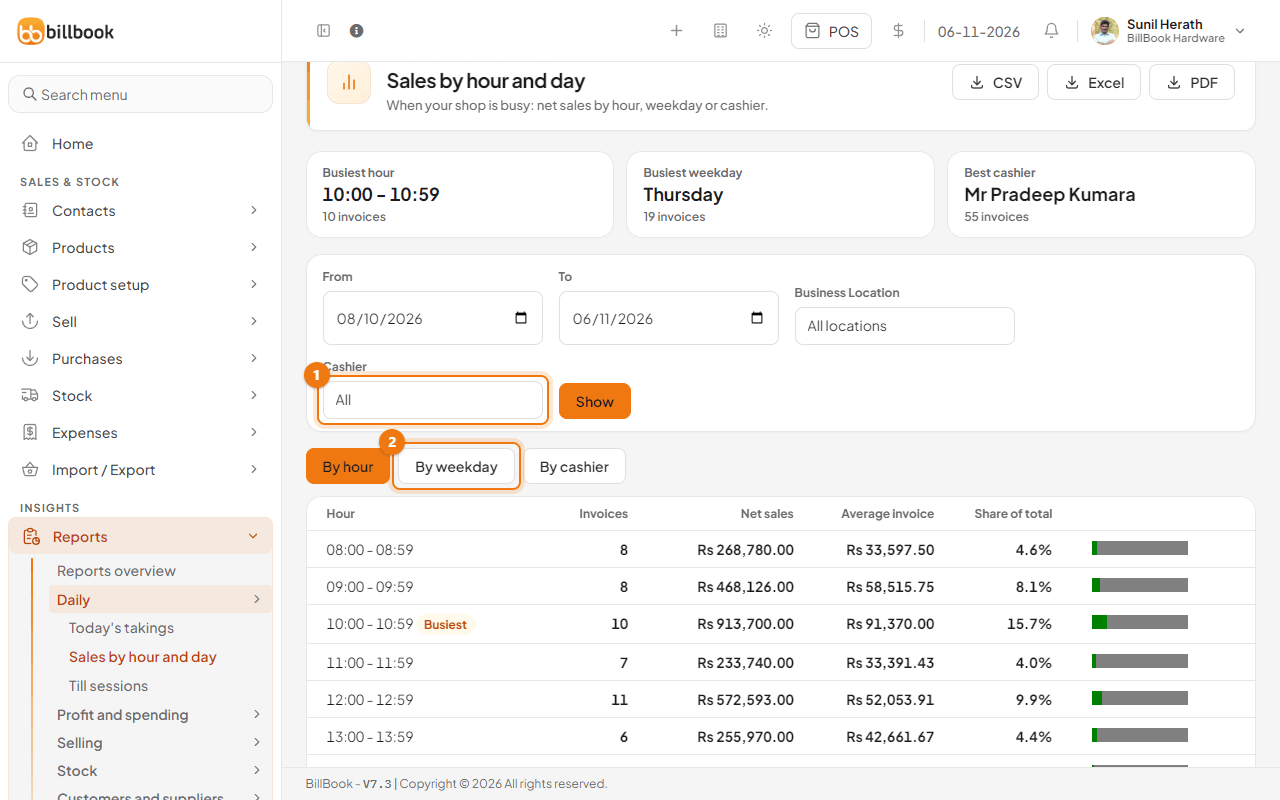
Use CSV, Excel or PDF at the top of the page to save the report.
Service staff report#
Service Staff Report shows the orders handled by each waiter. It only appears under Selling when the service staff module is on. See Turn on restaurant and salon features.
Table report#
Table Sales Report shows sales by restaurant table. It only appears under Selling when the tables module is on. See Turn on restaurant and salon features.
Activity log#
Reports > More reports > Audit Trail shows who added, changed or deleted records, and when. The page is called Activity Log.
- Choose the Date Range and, under By, the person you are checking.
- Use Subject Type (1) to look at one kind of record: Contact, User, Sell, Purchase, Sales Order, Purchase Order, Sell Return, Purchase Return, Stock Transfer, Stock Adjustment, Expense or Payment.
- Tick Hide sign-ins and sign-outs (2) to see only changes to your records.
- Read the cards: Changes in the dates chosen, Changes today, Deletions and Sign-ins.
- In the table, each row shows the date, the type of record, the record number, What happened (such as Added, Payment edited or a deletion), who did it and a note with the key details, such as the total and payment status of a purchase.
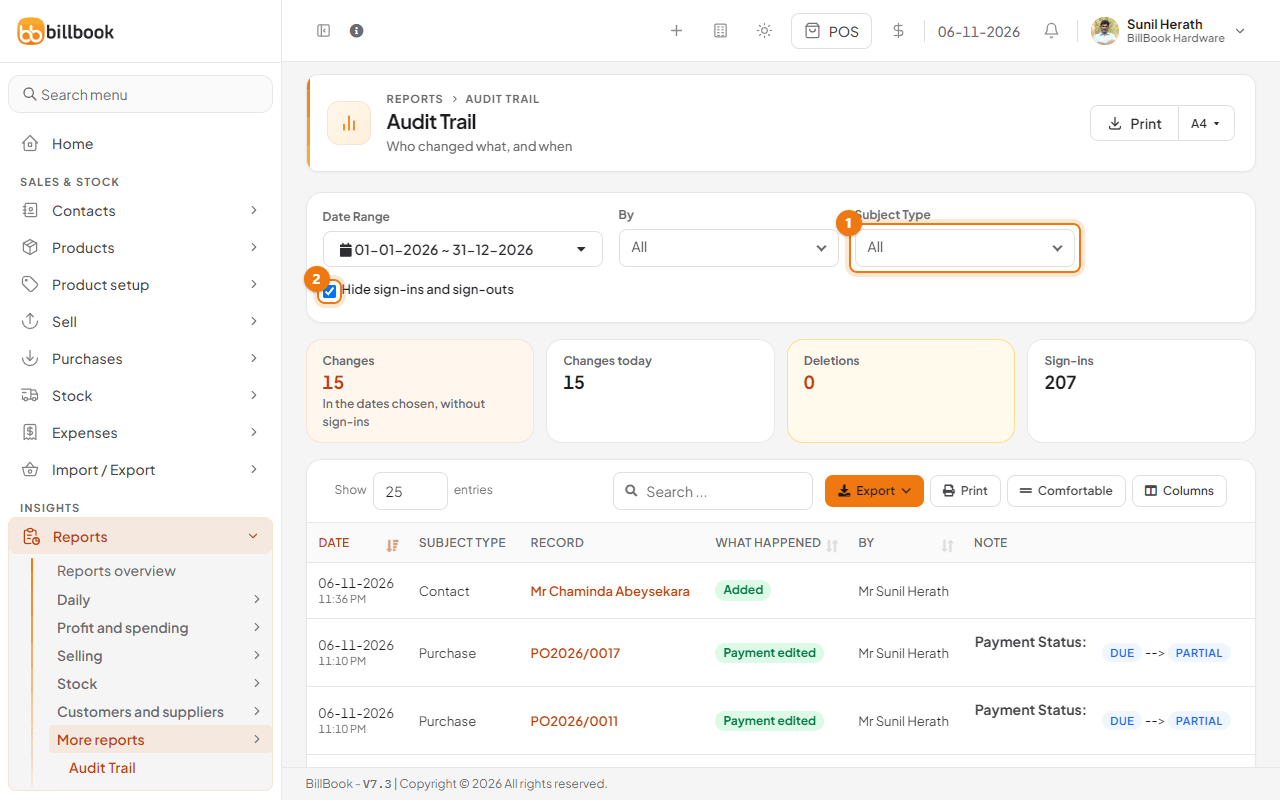
A deleted sale still appears here, marked No longer exists, with its invoice number in the note. Check this report when a total changes and nobody knows why.