
Sales and product reports
Last updated: 6 November 2026 · 5 min read
These reports show what sells, to whom and what each item earns you, and what you bought. Most are under Selling in the Reports menu; Profit on each item is under Profit and spending. Use them to decide what to reorder and what to stop stocking.
Before you start: Pick the date range first. See Reports overview for how the filters, saved views and exports work.
Best sellers#
Reports > Selling > What sells best opens Sales by Product. Its second tab, Best sellers, ranks your products for the dates you choose. It opens on this month.
- Select the Best sellers tab, then narrow the list with Category (1), Brand or Unit if you want, and choose a Business Location.
- Under Rank by, choose Revenue, Quantity (2) or Gross profit. The Ranking table and the Top 10 chart reorder at once.
- Read the cards: Revenue (without VAT, after discounts, less returns), Gross profit, Units sold, Products sold and the Top product. Each card compares with the previous period.
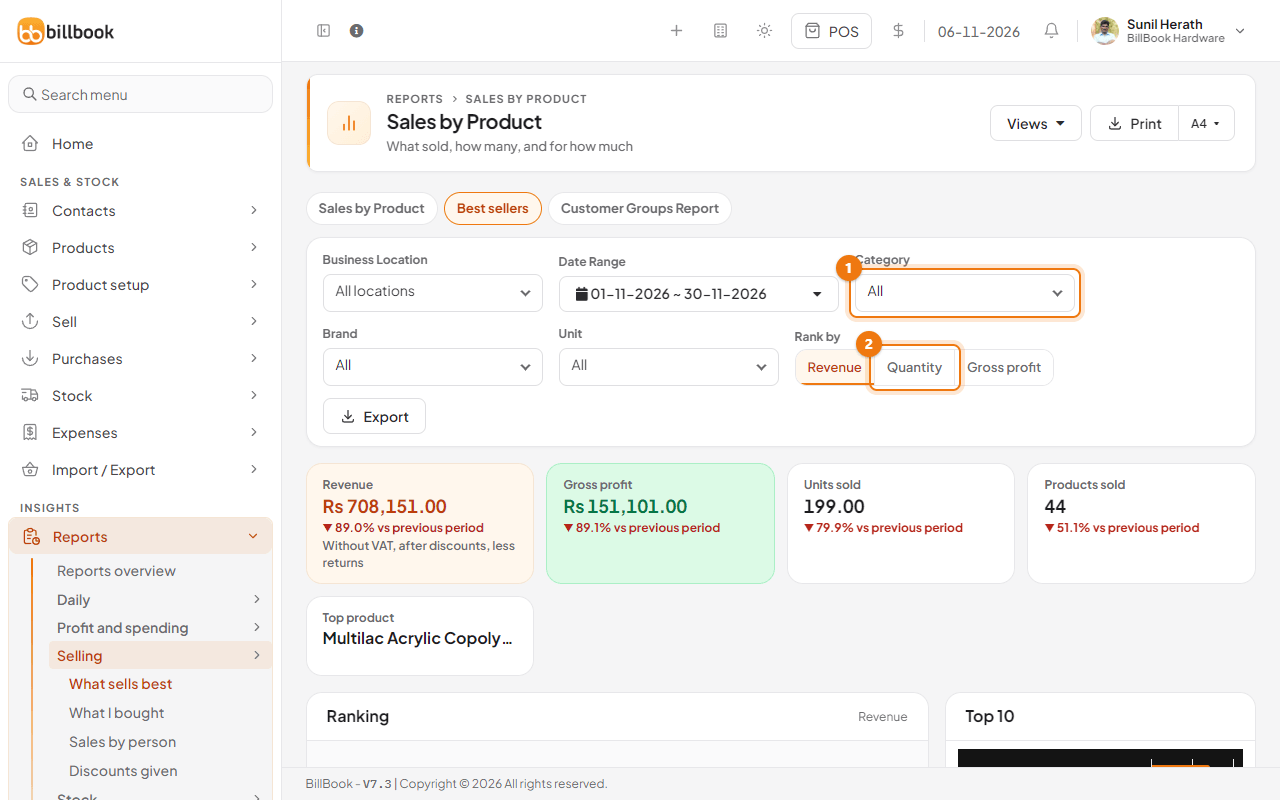
In the Ranking table, each product shows its quantity, revenue, gross profit, margin, the change from the previous period and the Stock left, so you can see at a glance when a fast seller is running low. Use Export to save the ranking.
Product sell report and grouping#
The first tab of Sales by Product lists every product sold. You choose how the lines are grouped.
- Use the filters at the top: Business Location, Date Range, Product, Customer, Category and Brand. Select More filters for Customer Group and the time of day.
- Choose a grouping button above the table: By product (1), By day (2), By category (3) or By brand. Every line shows each invoice line on its own.
- Read the cards: the Revenue, Units sold, Invoices, Average selling price and Top product.
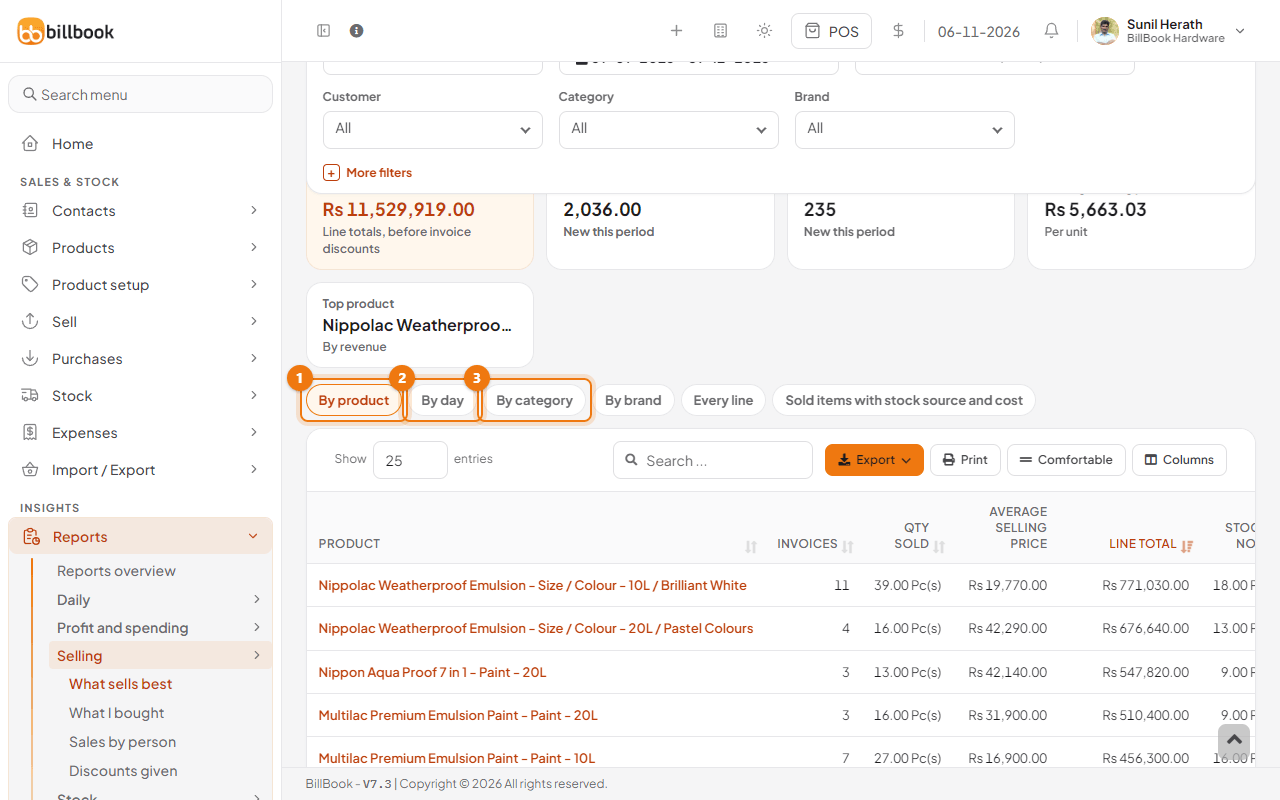
Use By day to see which days are busy, and By category or By brand to see which part of the range earns the most. The Sold items with stock source and cost button opens the next report.
Sold items cost#
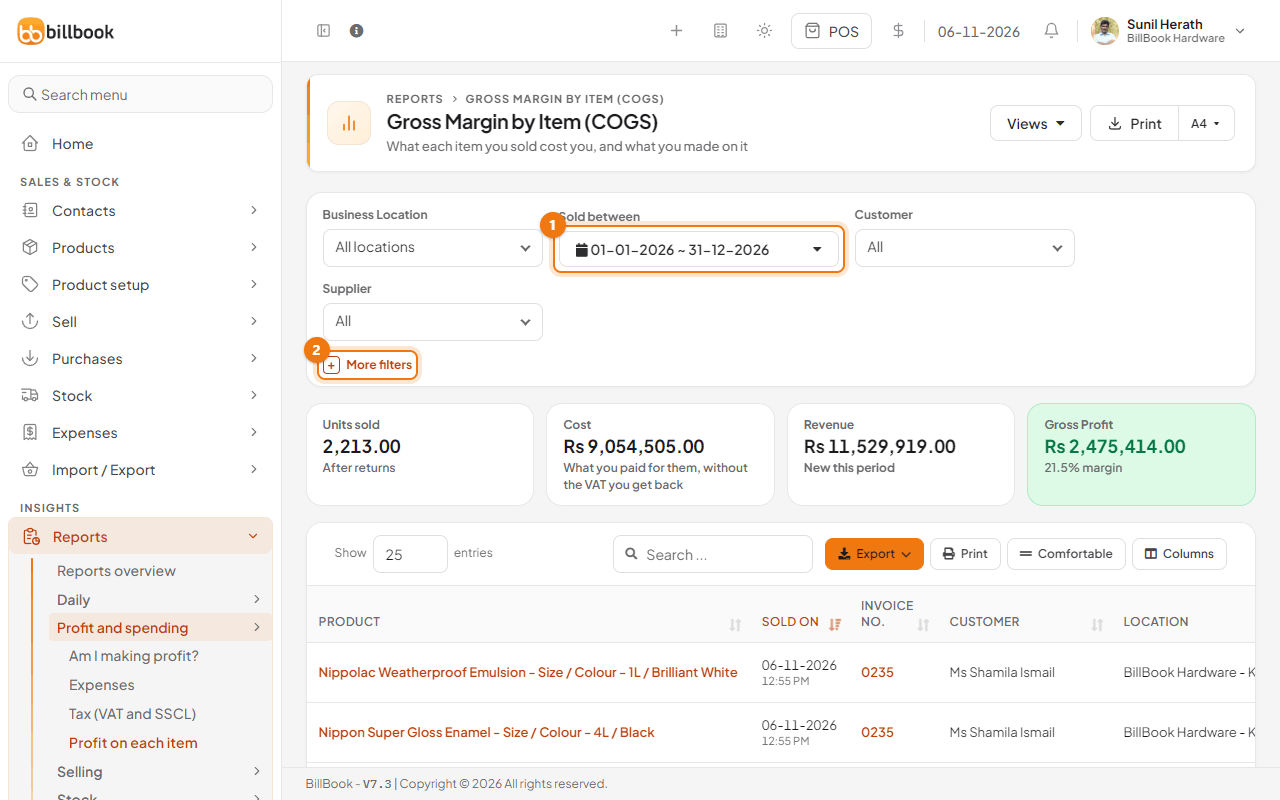
Reports > Profit and spending > Profit on each item shows each item you sold and the purchase it came from, so you can see what you really made on it. The page is called Gross Margin by Item (COGS).
- Choose the dates in Sold between (1). You can also filter by Business Location, Customer and Supplier. Select More filters (2) to filter by the date of the purchase.
- Read the cards: Units sold (after returns), Cost (what you paid, without the VAT you get back), Revenue and Gross Profit with the margin.
- In the table, each row is one sold item with the sold date, invoice number, customer, location, the purchase it was taken from (Stock from), the supplier, and its quantity, cost, revenue, gross profit and margin.
Product purchase report#
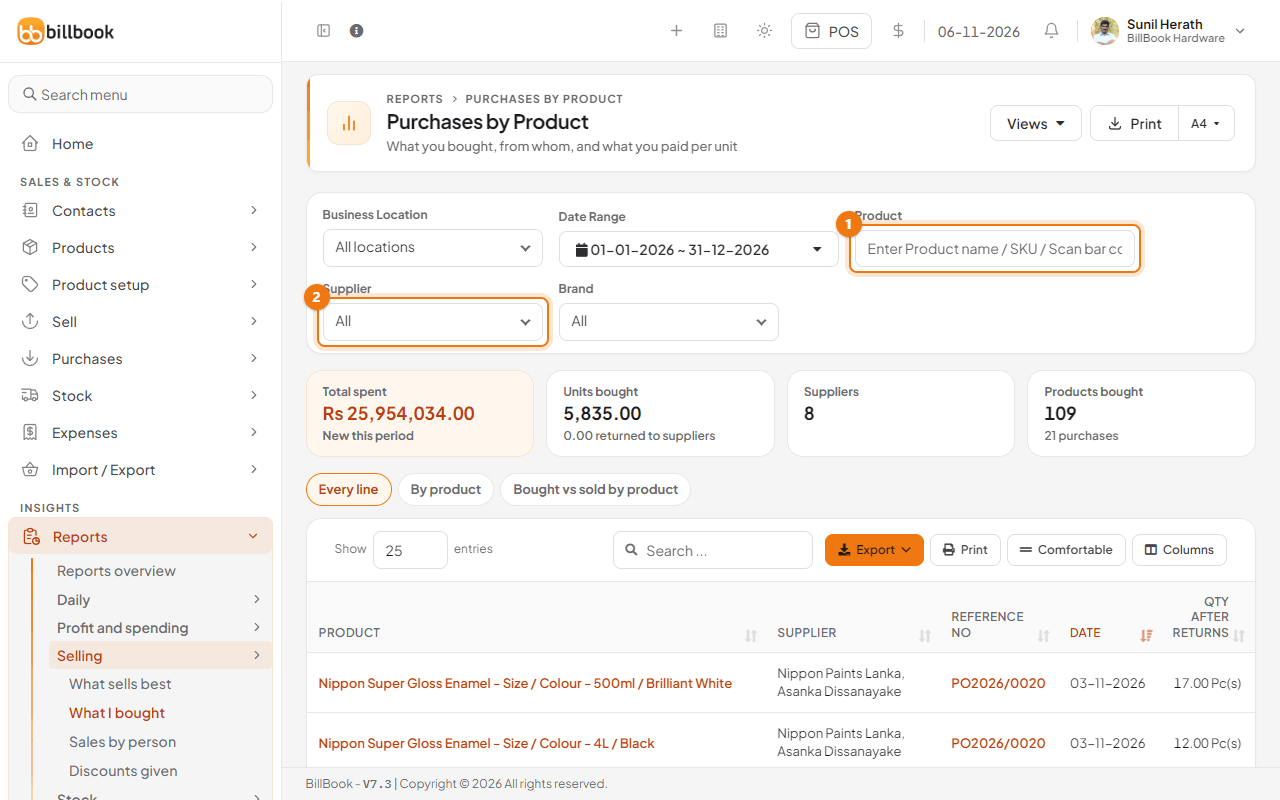
Reports > Selling > What I bought lists every product you bought, from whom and at what price. The page is called Purchases by Product.
- Type a name, SKU or barcode in Product (1), or choose a Supplier (2) or Brand.
- Read the cards: Total spent, Units bought (with how many were returned to suppliers), Suppliers and Products bought.
- Choose Every line to see each purchase line with its reference number, date, quantity after returns, unit cost and subtotal, or By product to add the lines up for each product.
Bought vs sold#
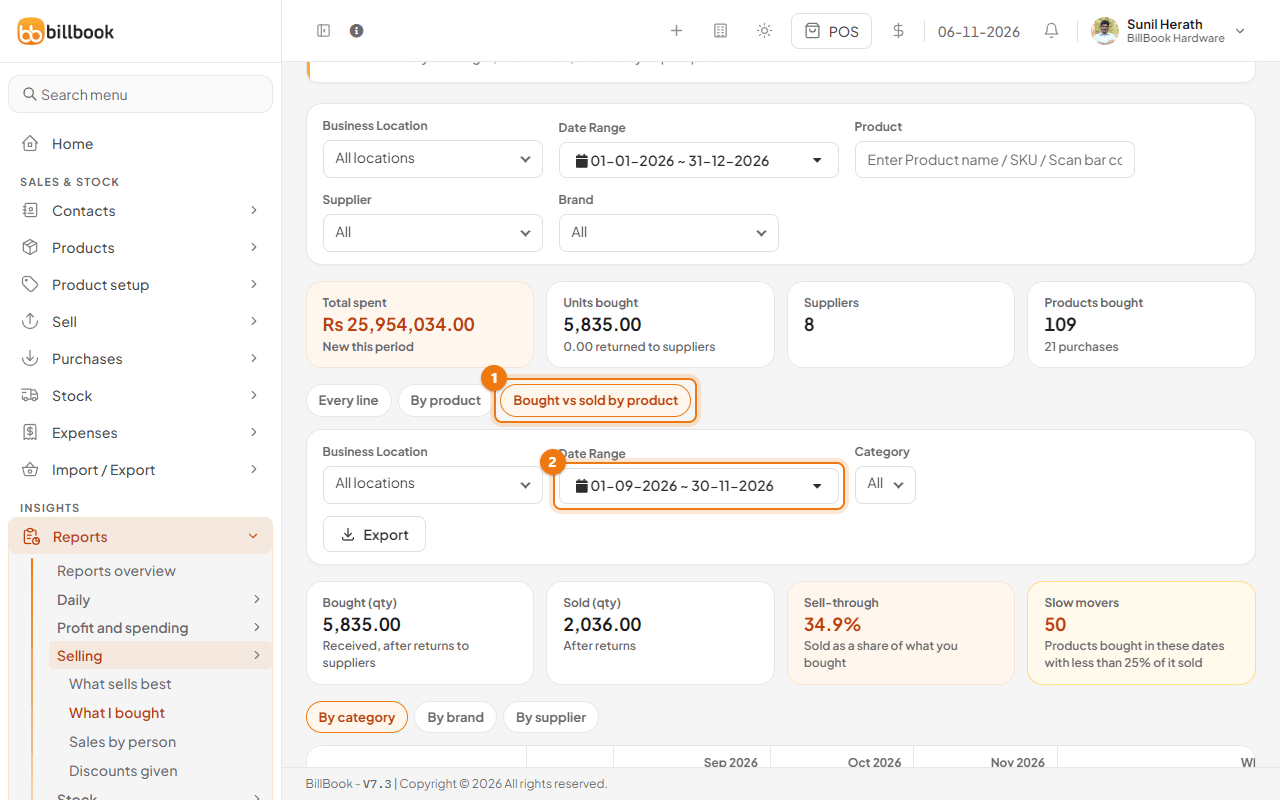
Bought vs sold by product is the third view of Purchases by Product. It compares, month by month, how much of each product you bought with how much sold. It opens on the last three months.
- Select Bought vs sold by product (1). It has its own Date Range (2) and a Category filter.
- Choose By category, By brand or By supplier to decide how the products are grouped.
- Read the cards. Sell-through is the share of what you bought that has sold. Slow movers counts the products bought in these dates of which less than 25% has sold.
- In the table, each product shows the Stock now, then Bought and Sold for each month, and a Whole range column with its sell-through. Use Export to save it.
Tip: Read the Whole range column to find products that sit on the shelf, then think twice before you reorder them.
Customer groups report#
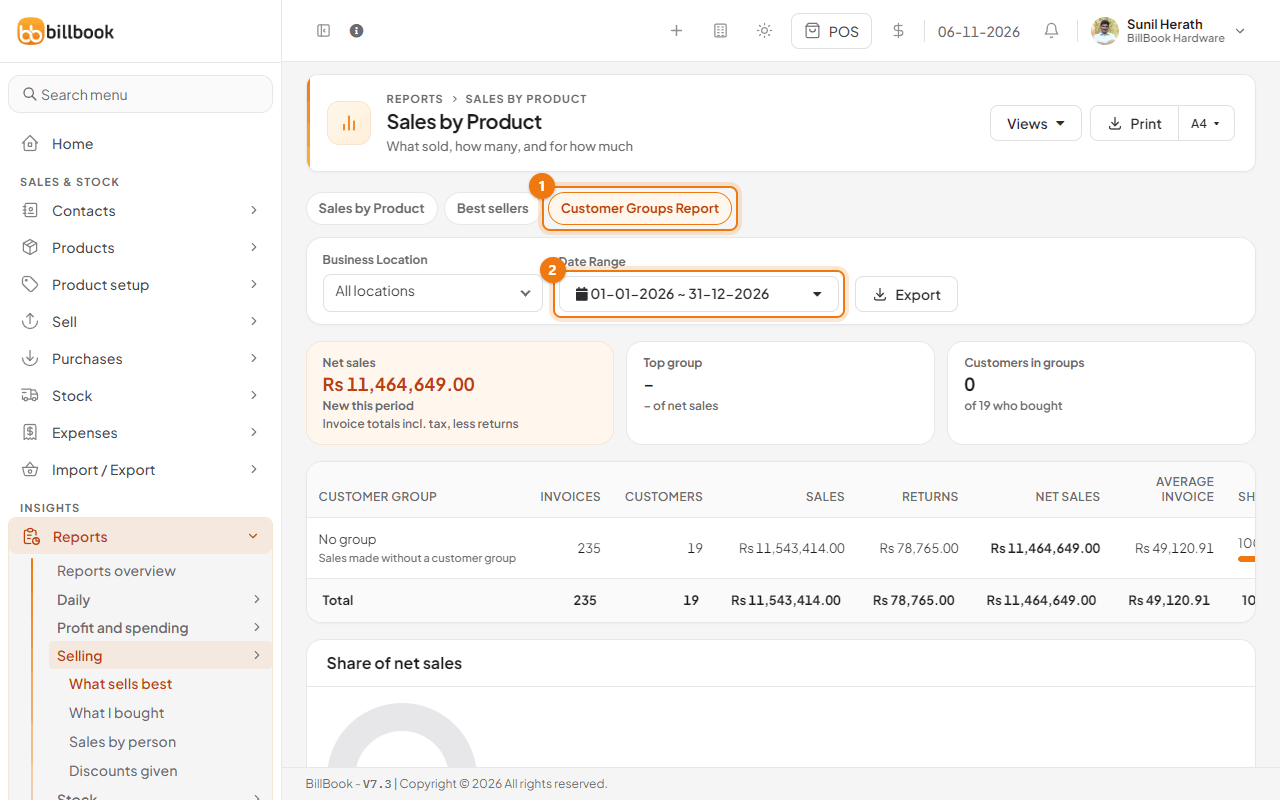
Customer Groups Report is the third tab of Sales by Product. It shows which kinds of customers your sales come from.
- Select the Customer Groups Report tab (1), then choose the Date Range (2) and Business Location.
- Read Net sales, the Top group and how many customers belong to a group out of those who bought.
- In the table, each group shows its invoices, customers, sales, returns, net sales, average invoice and Share. Sales without a group are listed as No group. Select a group to see what it bought.
Note: A sale counts under the customer group it was made with, even if the customer has moved to another group since. Set up groups under Contacts > Customer Groups.
Discounts given#
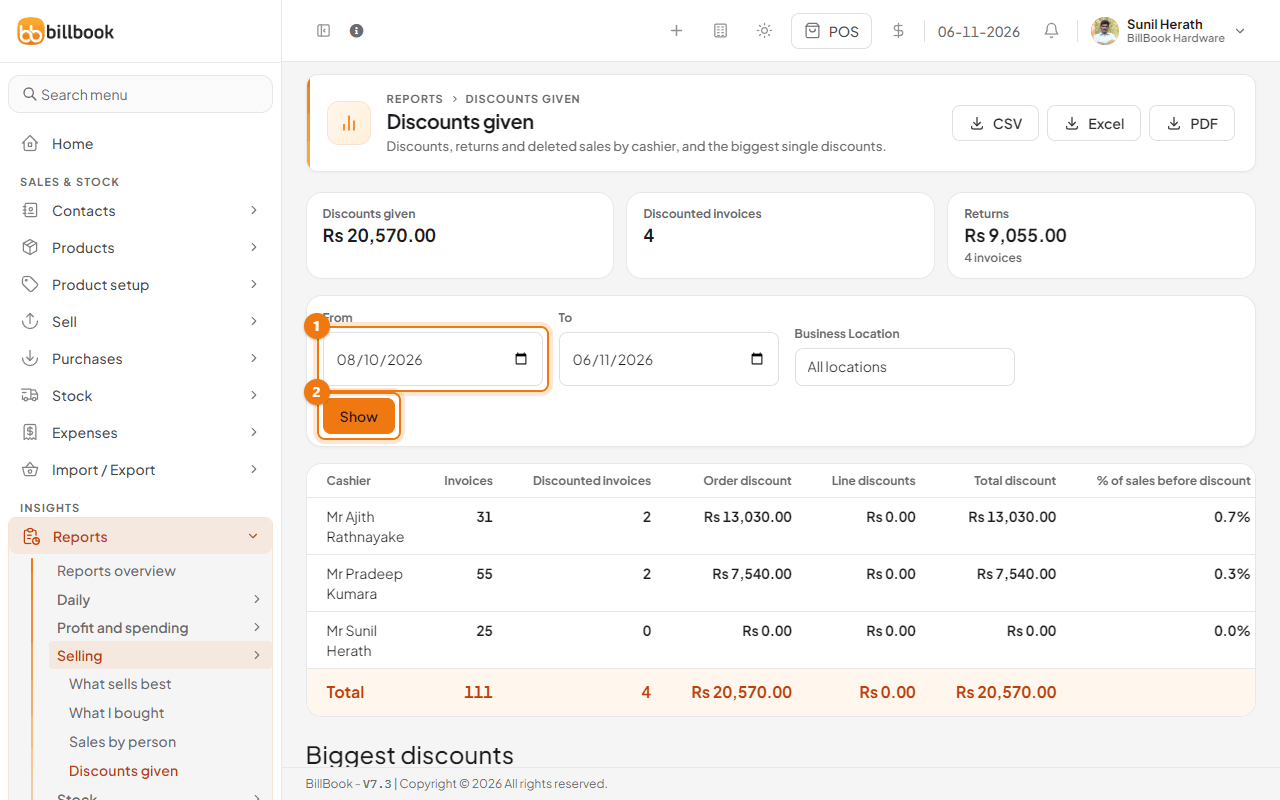
Reports > Selling > Discounts given shows how much discount you gave, returns and deleted sales, by cashier.
- Choose the From (1) and To dates and a Business Location, then select Show (2).
- Read the cards: Discounts given, Discounted invoices and Returns.
- In the table, each cashier shows their invoices, discounted invoices, Order discount, Line discounts, Total discount, the percentage of sales before discount, returns and deleted sales. Biggest discounts under it lists the largest single discounts, with the invoice, cashier and customer.
Use CSV, Excel or PDF at the top of the page to save the report.