Reports overview
Last updated: 6 November 2026 · 6 min read
Reports answer the questions you ask at the end of the day or the month: how much did we sell, what did it cost, who owes us money, what is left on the shelf. Start on the Reports overview, then open the report that answers your question.
Before you start: You only see the reports your role is allowed to open, and some reports need a feature switched on (for example the Account module for the Balance Sheet). If a report is missing from the menu, ask the owner to check your permissions under User Management > Roles and the modules under Settings > Business Settings > Modules.
How the Reports menu is grouped#
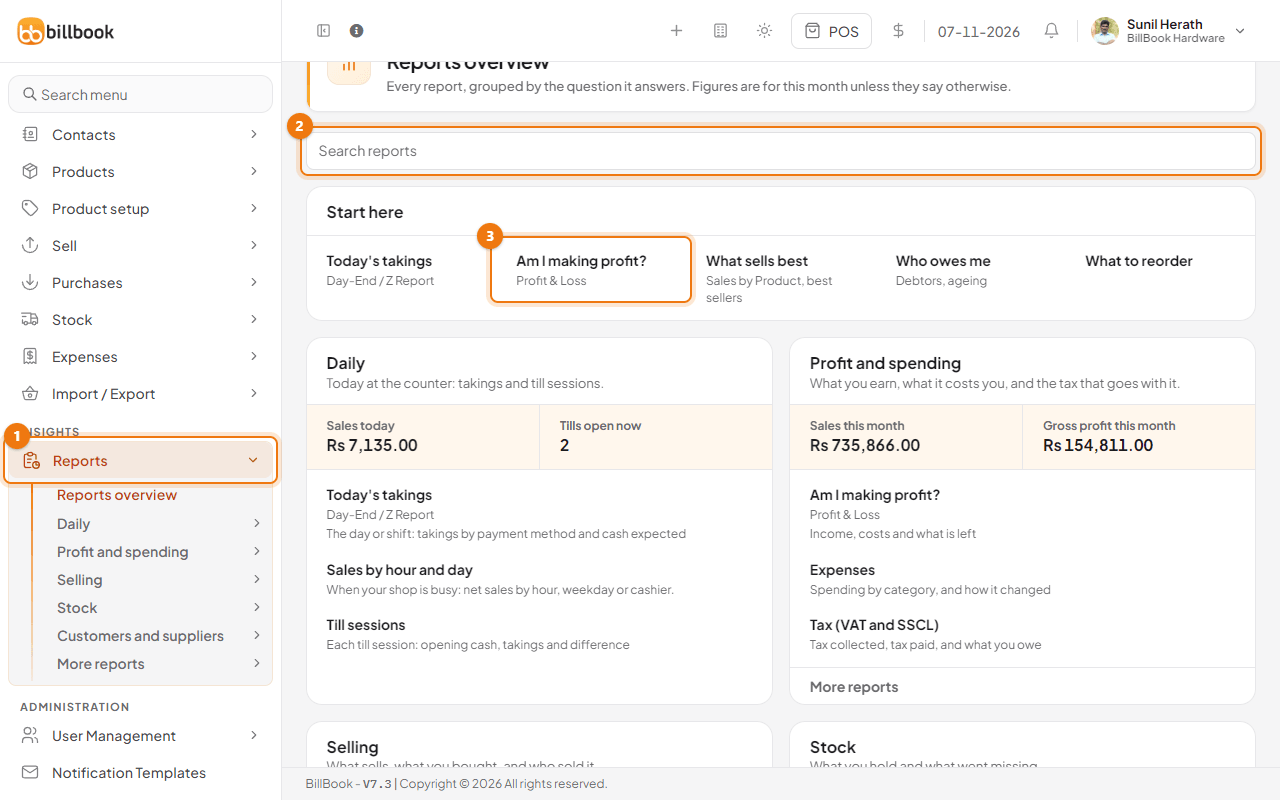
- Select Reports (1) in the left menu. It opens a list that starts with Reports overview, followed by six groups: Daily, Profit and spending, Selling, Stock, Customers and suppliers and More reports. Select a group to open it, then select the report.
- On Reports overview, the Start here row has the five reports most shops open first, such as Am I making profit? (3). Below it, each group has its own card with a short description and a list of its reports. Some cards show headline figures, such as Sales today or Customers owe you.
- Type in Search reports (2) to show only the reports that match. For example, type "cheque".
Under a card's list, More reports opens the advanced reports of that group. The menu and the overview use the same names, so you will find a report in the same place in both. When a report's page title is different from its menu name, the overview shows the page title under the menu name, for example Profit & Loss under Am I making profit?.
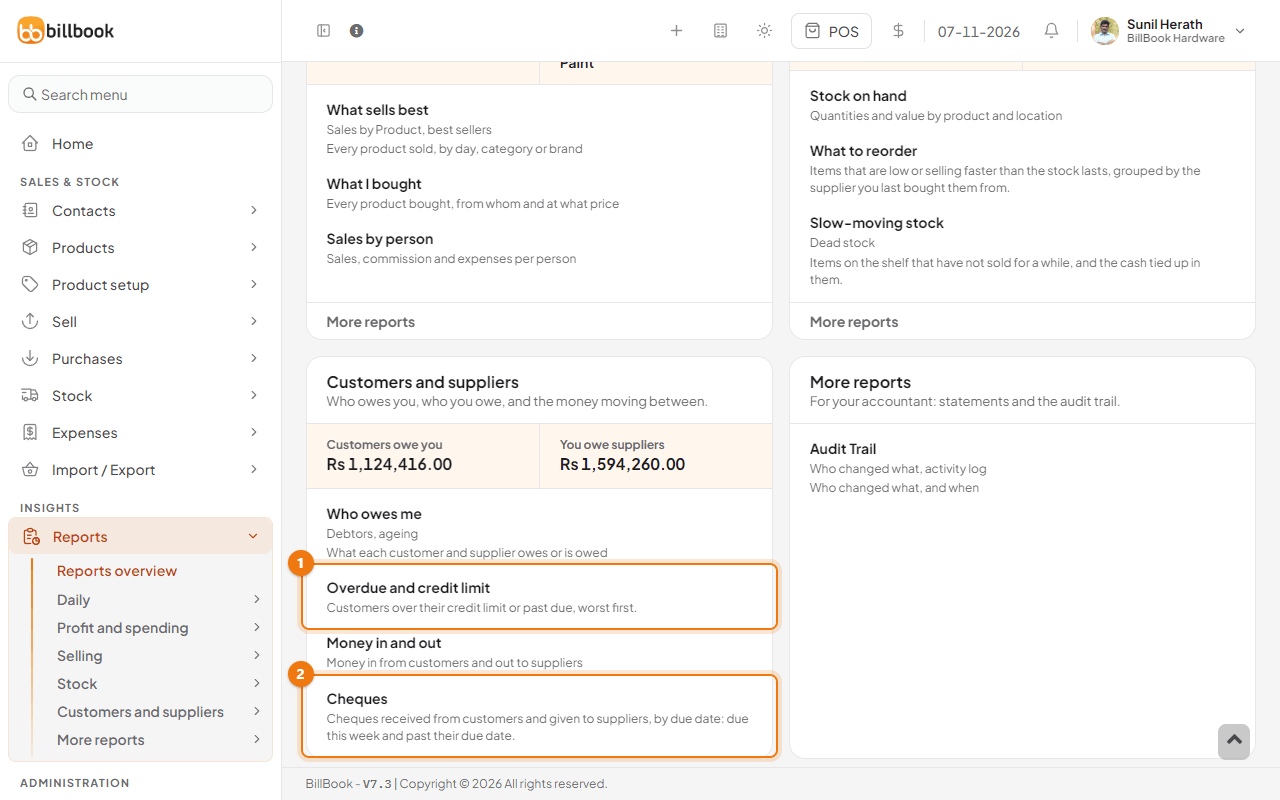
| Group | What it answers | Reports (menu name) | |---|---|---| | Daily | What happened today at the counter | Today's takings, Sales by hour and day, Till sessions | | Profit and spending | What you earn, what it costs you and the tax that goes with it | Am I making profit?, Expenses, Tax (VAT and SSCL), Profit on each item | | Selling | What sells, what you bought, and who sold it | What sells best, What I bought, Sales by person, Discounts given | | Stock | What you hold and what went missing | Stock on hand, What to reorder, Slow-moving stock, Stock losses and corrections | | Customers and suppliers | Who owes you, whom you owe, and the money moving between | Who owes me, Overdue and credit limit, Money in and out, Cheques | | More reports | For your accountant | Balance Sheet, Trial Balance, Audit Trail |
A few reports appear only when they apply. Stock losses and corrections needs the Stock Adjustment module, and Balance Sheet and Trial Balance need the Account module. Lot Report and Stock Expiry Report are tabs on Stock on hand when lot numbers and expiry dates are turned on. The restaurant reports Service Staff Report and Table Sales Report appear under Selling when the service staff and tables modules are on. Audit Trail is for the owner and admins only.
Note: The figures on the overview are for the current month, unless the label says otherwise.
Filters by location and date#
Every report has its own filters at the top of the page.
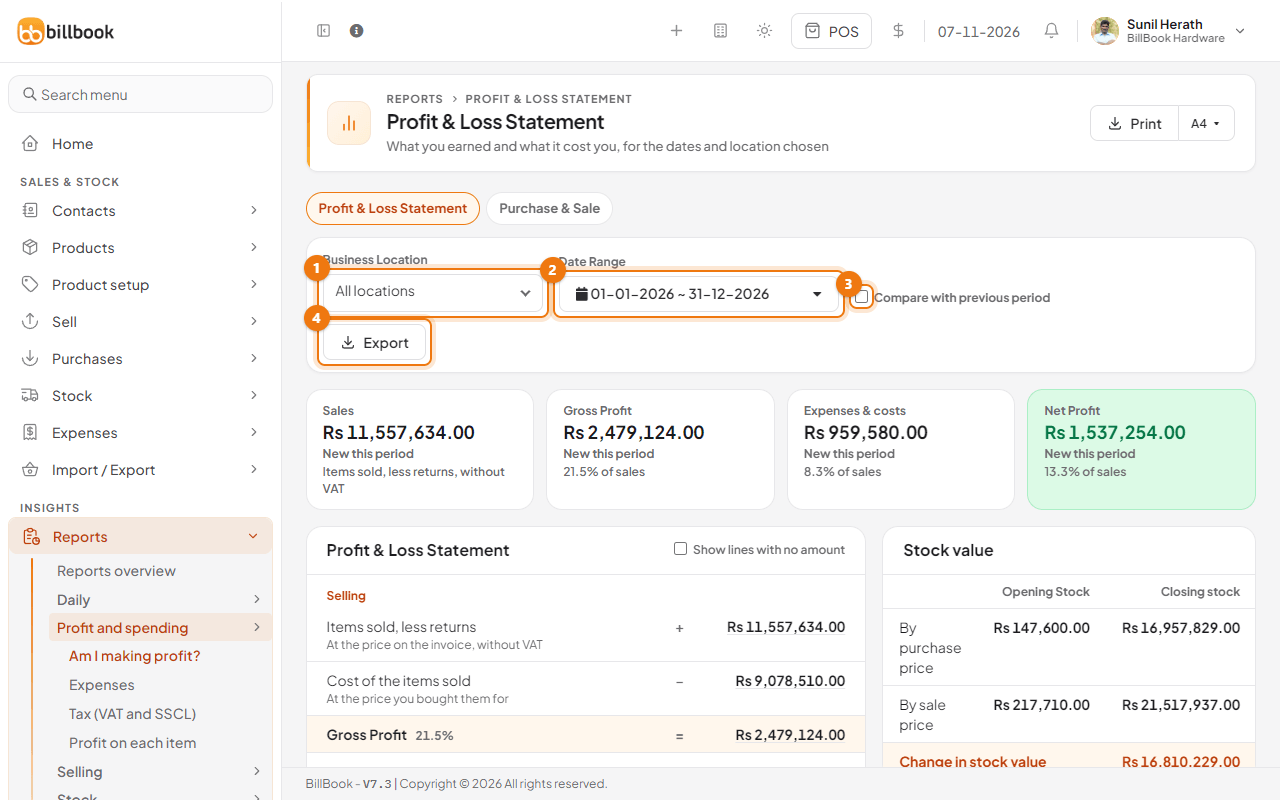
- Choose a Business Location (1) to see one shop, or leave All locations to add them together.
- Select the Date Range button (2) and pick a ready-made range: Today, Yesterday, Last 7 Days, Last 30 Days, This Month, Last Month, This month last year, This Year, Last Year, Current financial year or Last financial year. Choose Custom Range to enter your own dates.
- The report refreshes by itself when you change a filter. Some reports add more filters, such as category, brand, customer or cashier. They are covered on each report's page.
Tip: Check the date range before you read any number. Reports do not all open on the same dates. Day-End Report opens on today, Expense Report and Best sellers on this month, and most others on the whole year.
Compare with the previous period#
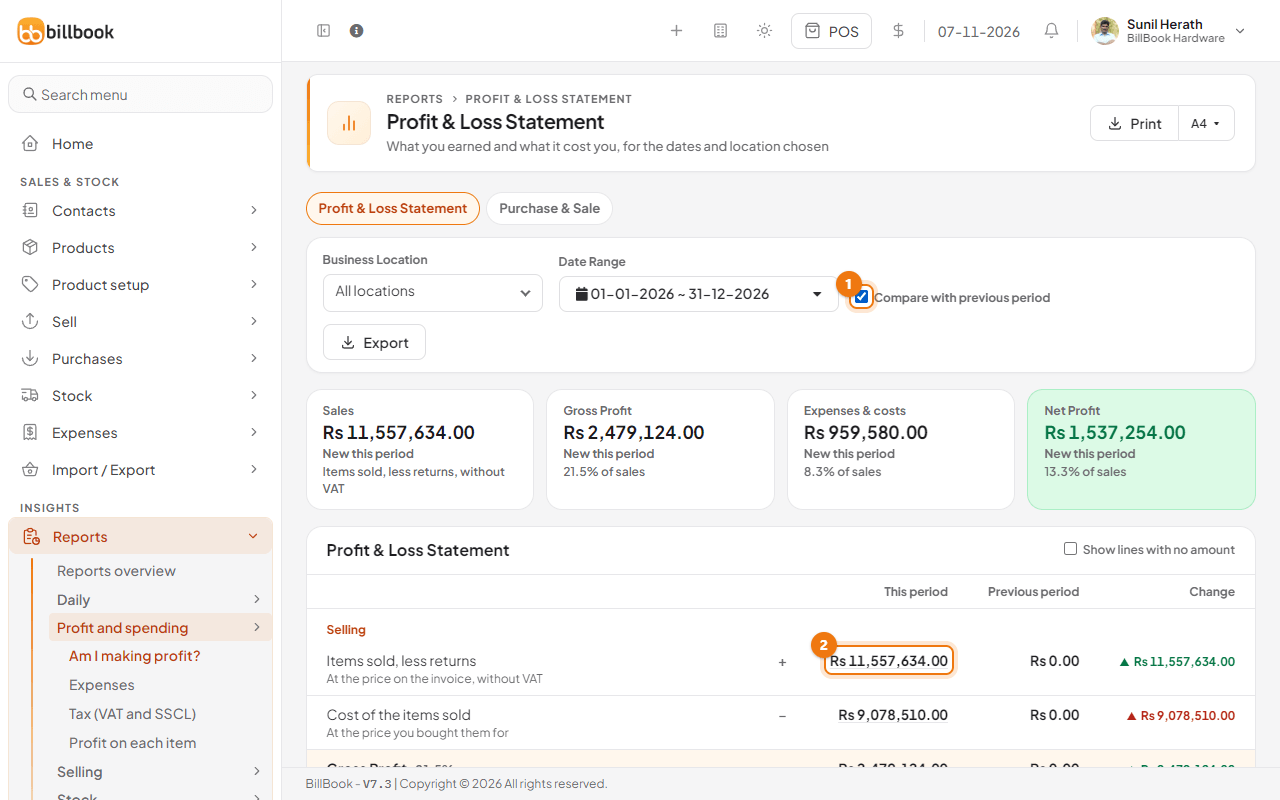
Tick Compare with previous period (3 in the picture above) on Am I making profit?, its Purchase & Sale tab, Expenses and Tax (VAT and SSCL). The cards then show how each figure changed from the period of the same length just before, and the statement gets a Previous period column. The comparison is also included when you export.
See the rows behind a figure#
Many totals are links. On Am I making profit?, select a figure such as Items sold, less returns (2) to open the report that lists the sales behind it, for the same dates and location. A figure is a link only when your role may open that report; otherwise it stays plain text.
Save a view#
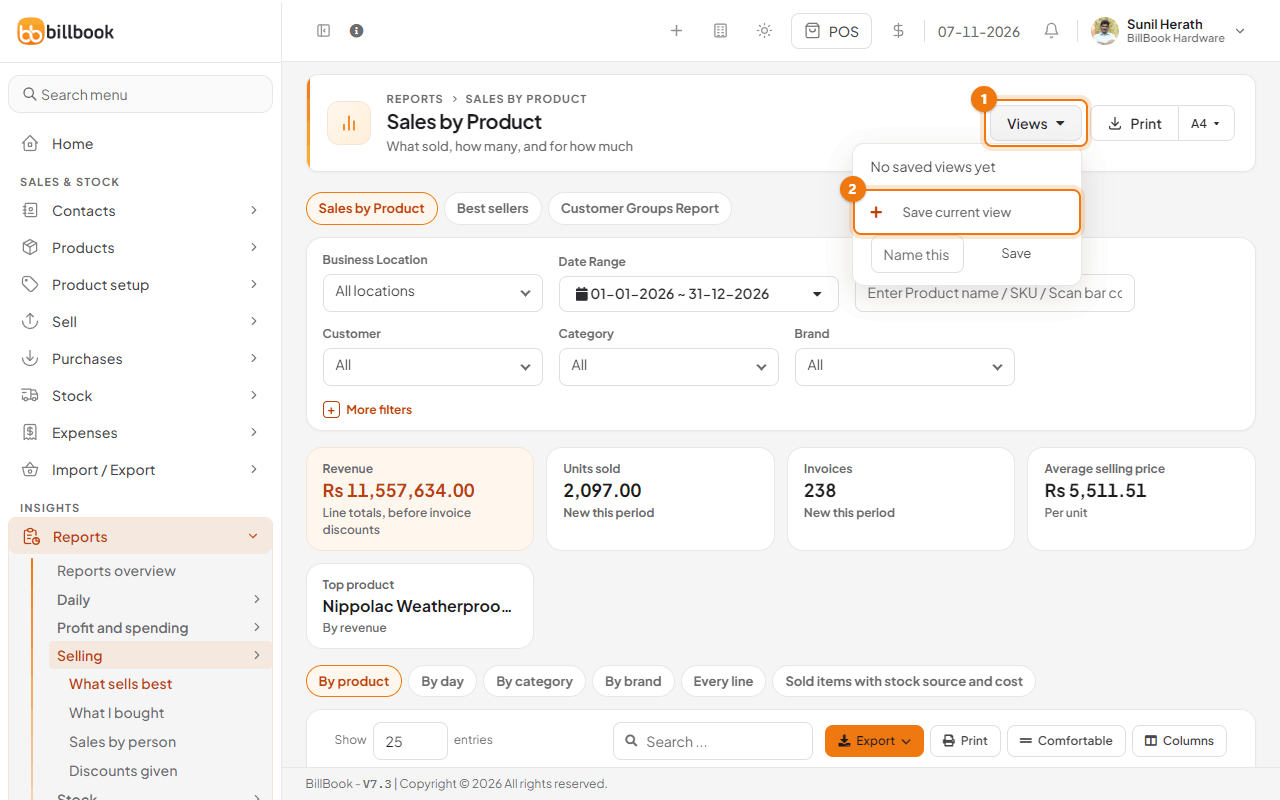
Some reports let you save the filters you use often, so you can open them again in one step. This is on What sells best (Sales by Product), Profit on each item, What I bought, Money in and out and Who owes me.
- Set the filters you want, such as a date range and a category.
- Select Views (1), then Save current view (2), type a name in the box below it and select Save.
- To use it later, select Views and then the name. To remove it, select the bin icon next to the name.
Saved views belong to you; other users do not see them.
Export and print#
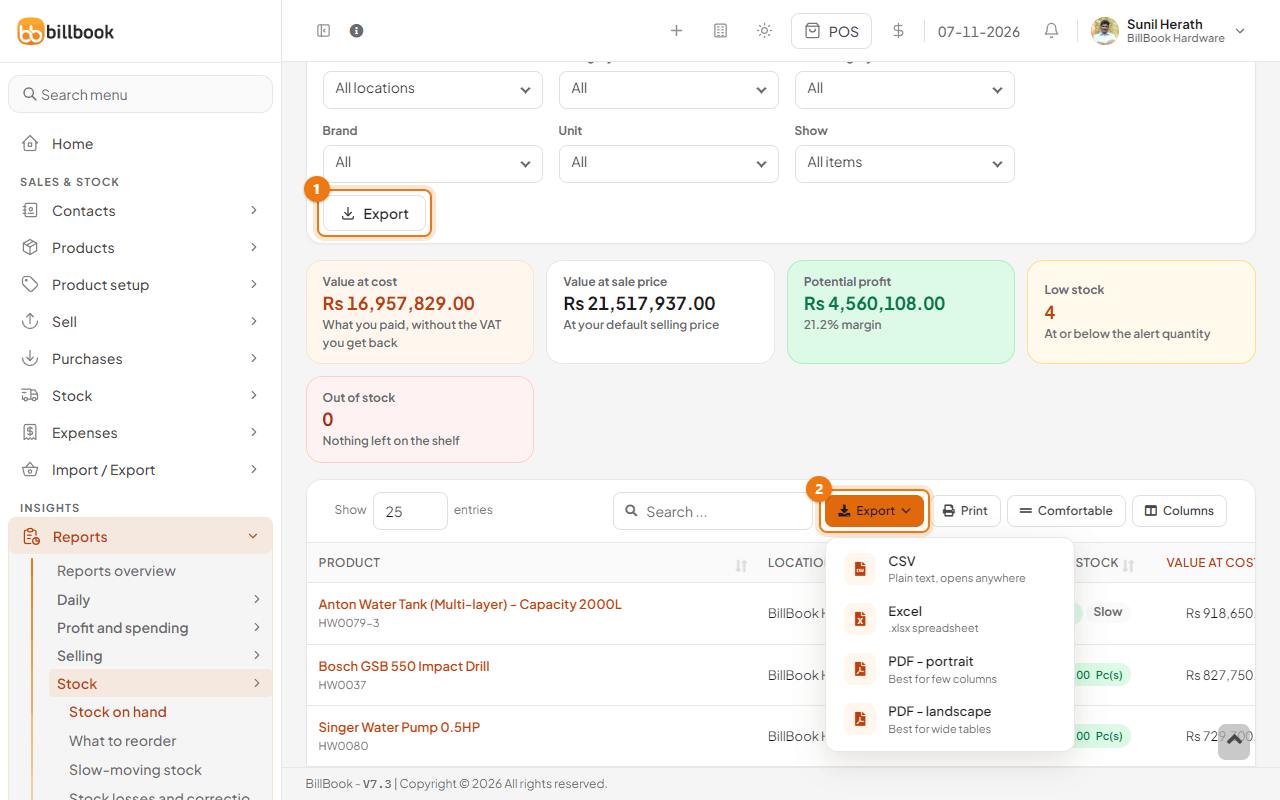
- To save a report, select Export on the filter bar (1 below) and choose CSV, Excel or PDF. The file has the same figures as the screen, for all rows, with the same filters.
- To save only the table, select Export (2) on the table's toolbar and choose CSV, Excel, PDF - portrait or PDF - landscape. Use landscape for wide tables.
- Some reports, such as What to reorder, Slow-moving stock, Discounts given and Cheques, show CSV, Excel and PDF buttons at the top of the page instead.
- To print a report page, select Print at the top right. The arrow next to it (A4) lets you choose the paper size. The table toolbar has its own Print button too, a Comfortable button that changes how tight the rows are, and Columns to hide columns you do not need.