Money reports
Last updated: 6 November 2026 · 7 min read
The money reports tell you whether the shop is making a profit, how much cash the till should hold at closing time, and what the business owns and owes. Open them from Reports: Am I making profit? and Expenses are under Profit and spending, Today's takings is under Daily, and the Balance Sheet and Trial Balance are under More reports. Sales that are on hold at the POS are not counted in any of the sales figures.
Before you start: Balance Sheet and Trial Balance only show when the Account module is on in Settings > Business Settings > Modules. Expenses needs the Expenses module. All reports follow the filters described in Reports overview.
Profit and loss#
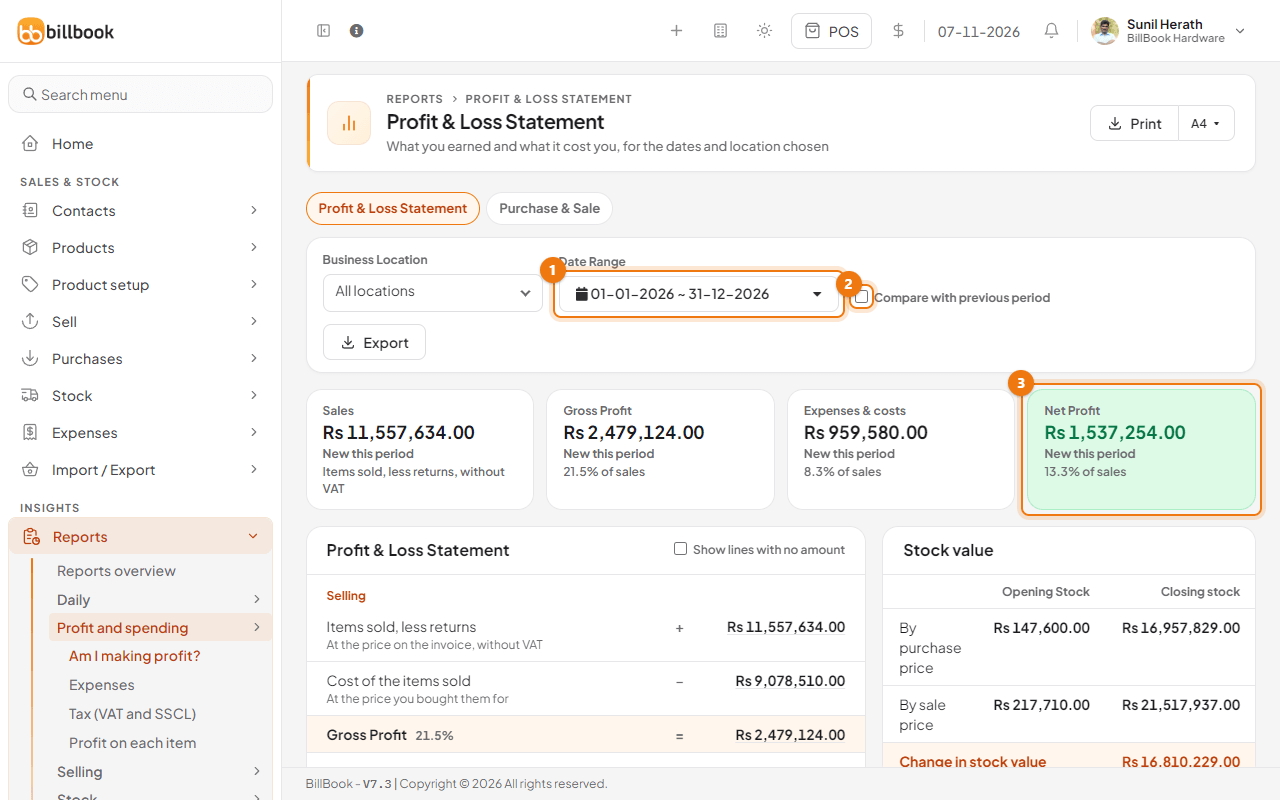
Use Reports > Profit and spending > Am I making profit? to see what is left after the cost of your goods and your expenses. The page is called Profit & Loss Statement.
- Select the Date Range button (1) and choose a range, for example This Month. You can also choose a Business Location. The report opens on the whole year.
- Tick Compare with previous period (2) if you want to see how each figure changed.
- Read the four cards: Sales, Gross Profit, Expenses & costs and Net Profit (3). Sales are the items sold less returns, without VAT.
Below the cards, the Profit & Loss Statement works down in steps:
- Selling: the items sold at the price on the invoice, without VAT, less returns, minus the Cost of the items sold (what you paid for them, without the VAT you get back). The result is the Gross Profit (2) and its percentage of sales.
- Other income: Total Stock Recovered and any shipping charges.
- Expenses and other costs: Total Expense split by category, Stock written off (adjustments) and Total Sell discount.
- Net Profit: gross profit plus other income, less all of the costs above.
Lines that are zero are hidden. Tick Show lines with no amount (1 below) to see them. Select an amount in the statement to open the rows behind it.
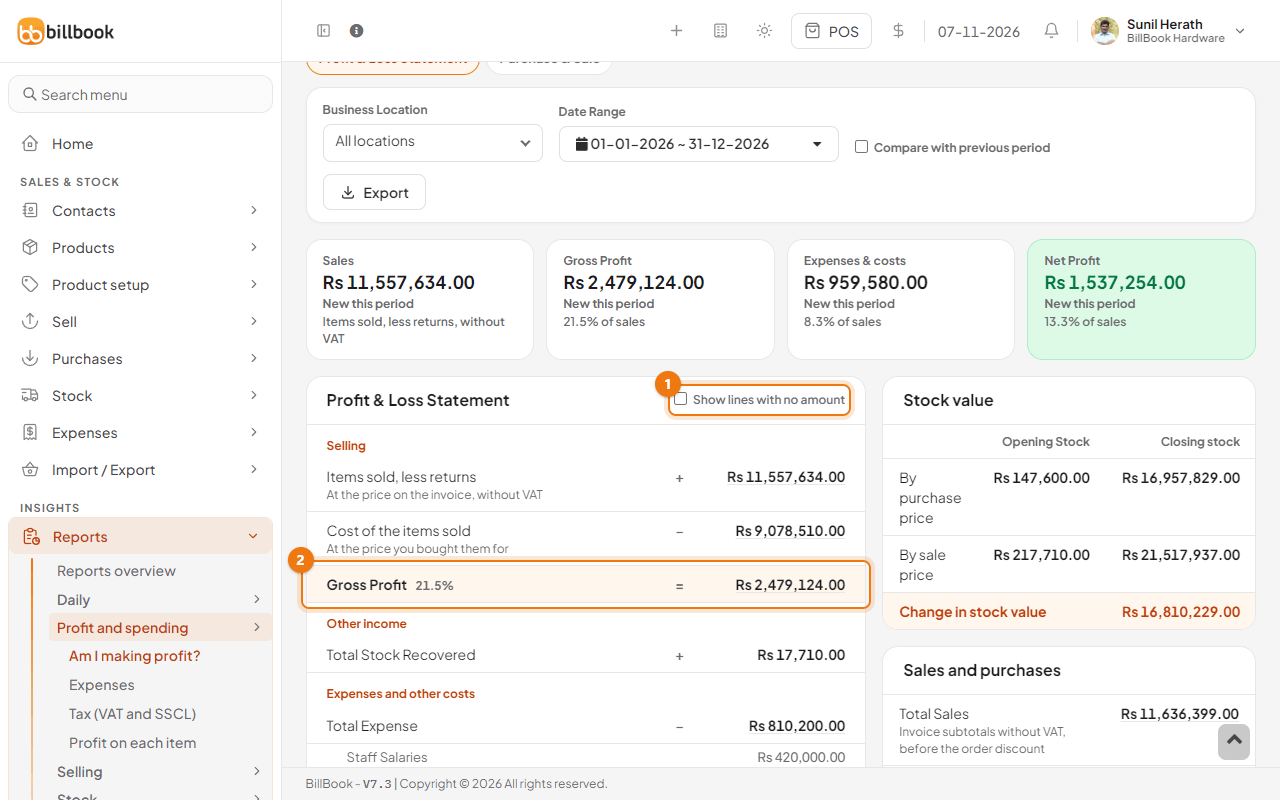
Beside the statement you also get a Stock value box (opening and closing stock at purchase price and at sale price), a Sales and purchases box and, when you charge tax, a Tax Summary. Under them, tabs break the profit down: Profit by products, Profit by categories, Profit by brands, Profit by locations, Profit by invoice, Profit by date, Profit by customer, Profit by day and Profit by service staff. Use Export to save the statement as CSV, Excel or PDF.
Note: The profit-by-product, category and brand tabs only count the discount given on each line. A discount on the whole invoice is not included there, but it is included in the statement and in Net Profit.
Day closing (Z report)#
Use Reports > Daily > Today's takings at the end of the day or a shift to see the money that came in and went out. The page is called Day-End Report (Z Report) and opens on today.
- To close one person's shift, choose their name in Cashier (1). Leave it on All for the whole shop. You can also change the Business Location and Date Range.
- Check Net cash in (2): the cash paid in less the cash paid out on these dates, from every screen, before any opening float.
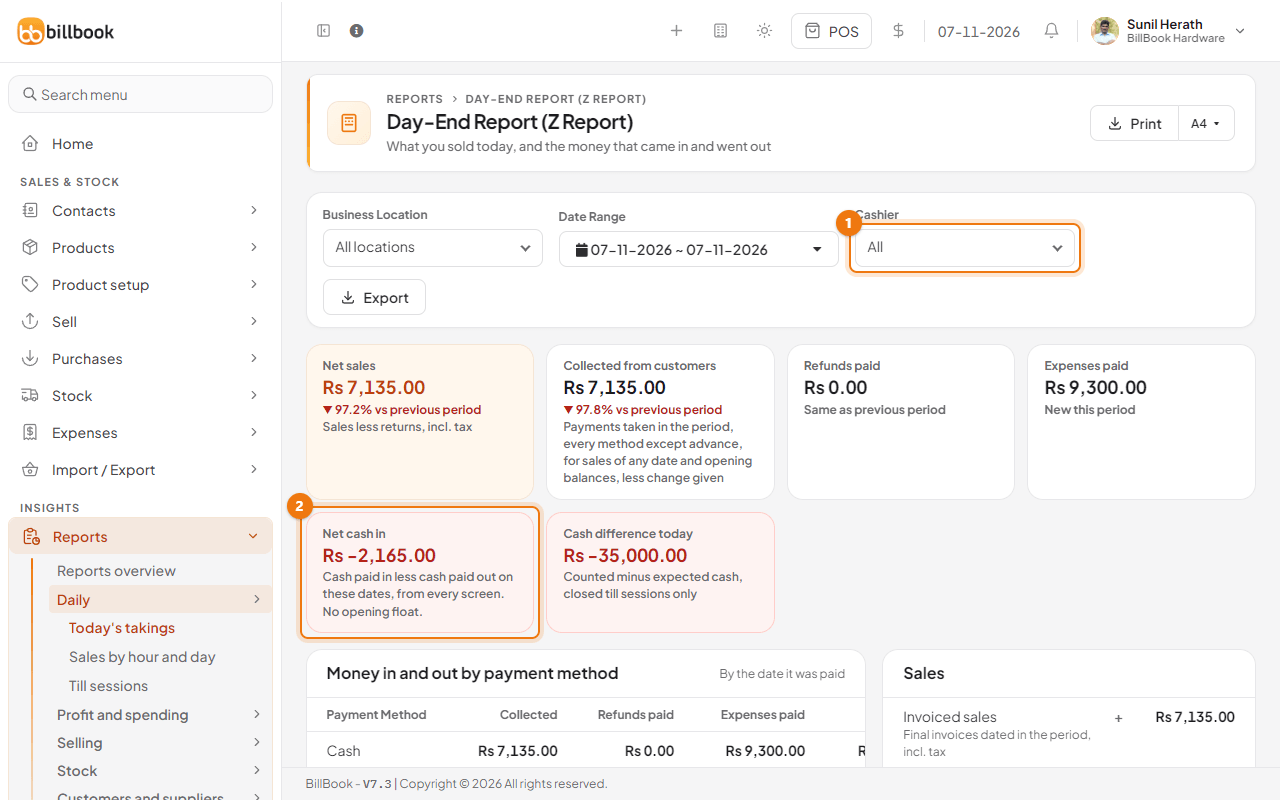
The other cards show Net sales (sales less returns, with tax), Collected from customers (payments taken on those dates, for sales of any date, less change given), Refunds paid, Expenses paid and the Cash difference today of closed till sessions. Under them:
- Money in and out by payment method lists cash, card and the other methods, with what was collected, refunded and spent.
- Cash register sessions lists each till session with its opening cash, the cash expected in the drawer and the amount counted at close. Select Counter Shift Report to see the takings and closing notes of every session.
- Sales shows the invoiced sales, less returns, for the dates chosen, and Sales by person splits them by cashier.
- Also today lists cheques due today and tomorrow, discounts given, sales returns, deleted sales and items at or below their alert quantity.
Purchase and sale#
Purchase & Sale is the second tab of the Profit & Loss Statement page. It puts what you sold next to what you bought, and shows what is still owed both ways.
- Select the Purchase & Sale tab (1) and choose the Date Range (2), for example This Month.
- Read the cards. Net sales and Net purchases are after returns and include tax. Sales less purchases (3) is not your profit, because stock you have bought but not yet sold is counted as spending. Customers owe you and You owe suppliers show unpaid invoices in those dates.
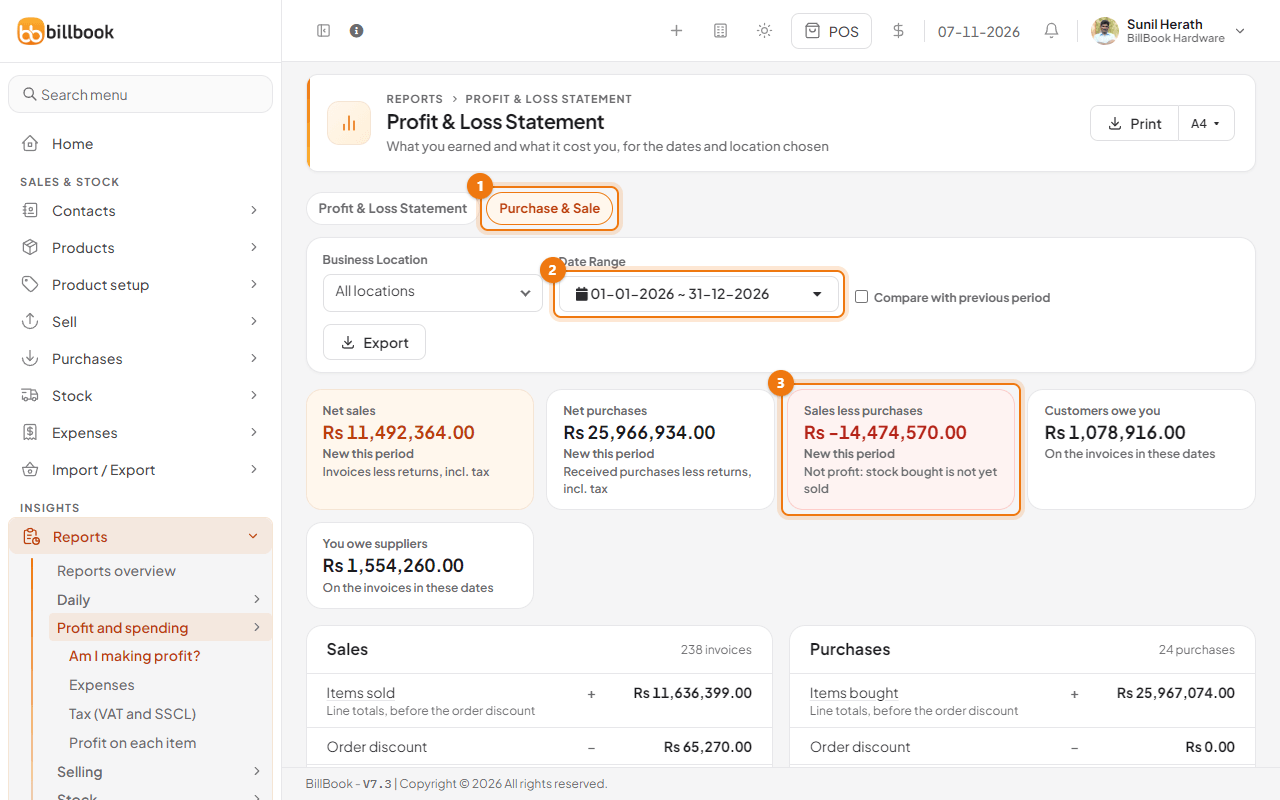
Below the cards, the Sales and Purchases boxes show how each total is built up: items, order discount, tax, shipping, returns, what has been paid and what is still due. Select Open the sales list or Open the purchase list to see the invoices behind the numbers. A chart at the bottom shows sales and purchases month by month. You can compare with the previous period and export this tab too.
Expense report#
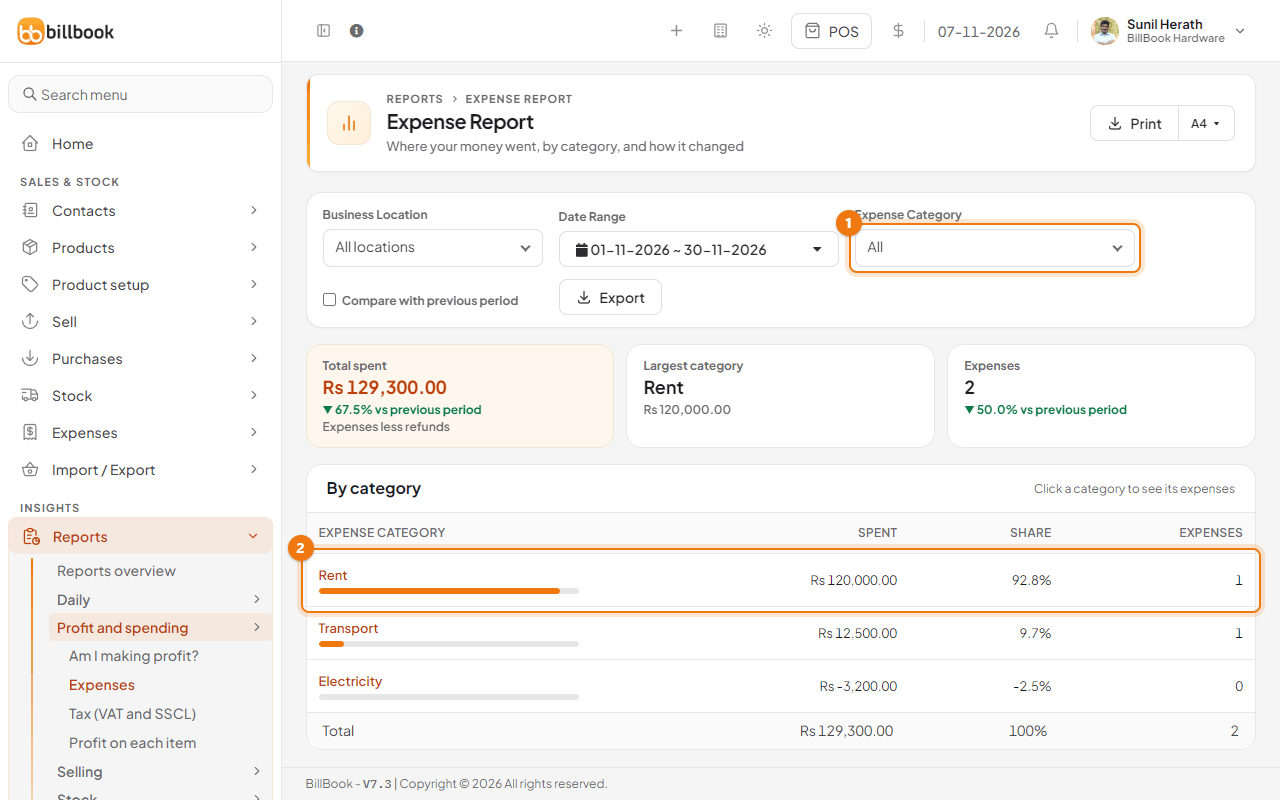
Reports > Profit and spending > Expenses shows where your money went. It opens on this month.
- To look at one kind of spending, choose it in Expense Category (1). Choosing a category also includes its sub-categories.
- Read Total spent, the Largest category and the number of Expenses. Each card compares with the previous period.
- In the By category table, each row shows the amount, its Share of the total and the number of expenses. Select a category such as Rent (2) to see the expenses inside it. Tick Compare with previous period to add the previous period and the change to the table.
Balance sheet#
Reports > More reports > Balance Sheet shows what the business owns and owes on one date.
- Choose the date in the box on the left (1). It opens on today.
- Choose a Business Location (2), or leave All locations. Select Reset to go back to today and all locations.
- Read Total Assets, Total Liability and Owner's equity.
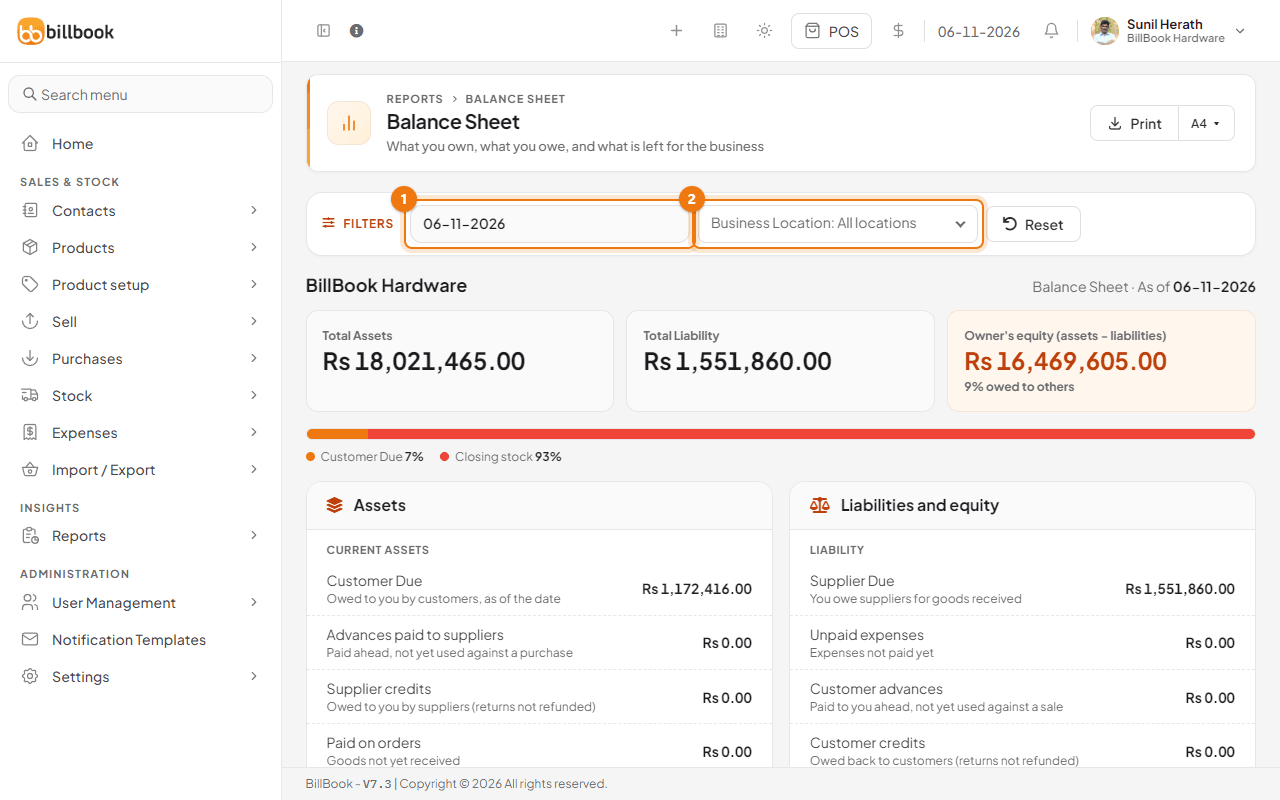
Under Assets you get Customer Due (what customers owe you), Advances paid to suppliers, Supplier credits, Paid on orders (goods not yet received), Closing stock at cost and the balance of each payment account. Under Liabilities and equity you get Supplier Due, Unpaid expenses, Customer advances, Customer credits and Owner's equity. Equity is the balancing figure: assets minus what you owe. BillBook keeps no capital or retained-profit account, so it does not prove that your books balance.
Trial balance#
Reports > More reports > Trial Balance lists the same figures as debits and credits. Debit (1) holds what you are owed and what you have in your accounts. Credit (2) holds what you owe. Because owner's equity is the balancing figure, both sides always agree.
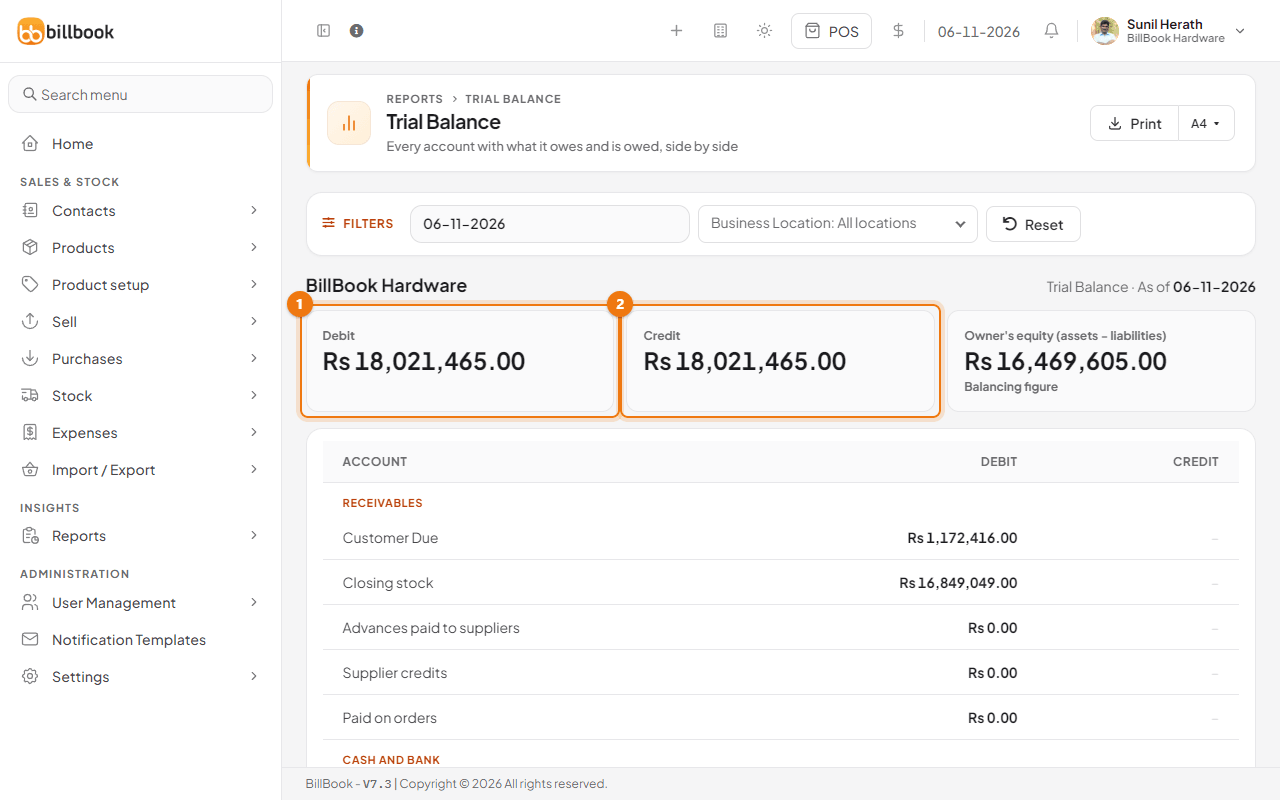
It has the same date and location filters as the balance sheet.