Tour the home dashboard
Last updated: 7 November 2026 · 5 min read
The home dashboard is the first screen you see after you sign in. It shows how the shop is doing and what needs your attention today, so you can check it in a minute before you start work.
Before you start: Sign in to BillBook. The dashboard opens on Home in the left menu. What you see depends on your role, so a cashier may see fewer cards than the owner. For a guided walk through the screen, see Take the Application Tour.
Change the period#
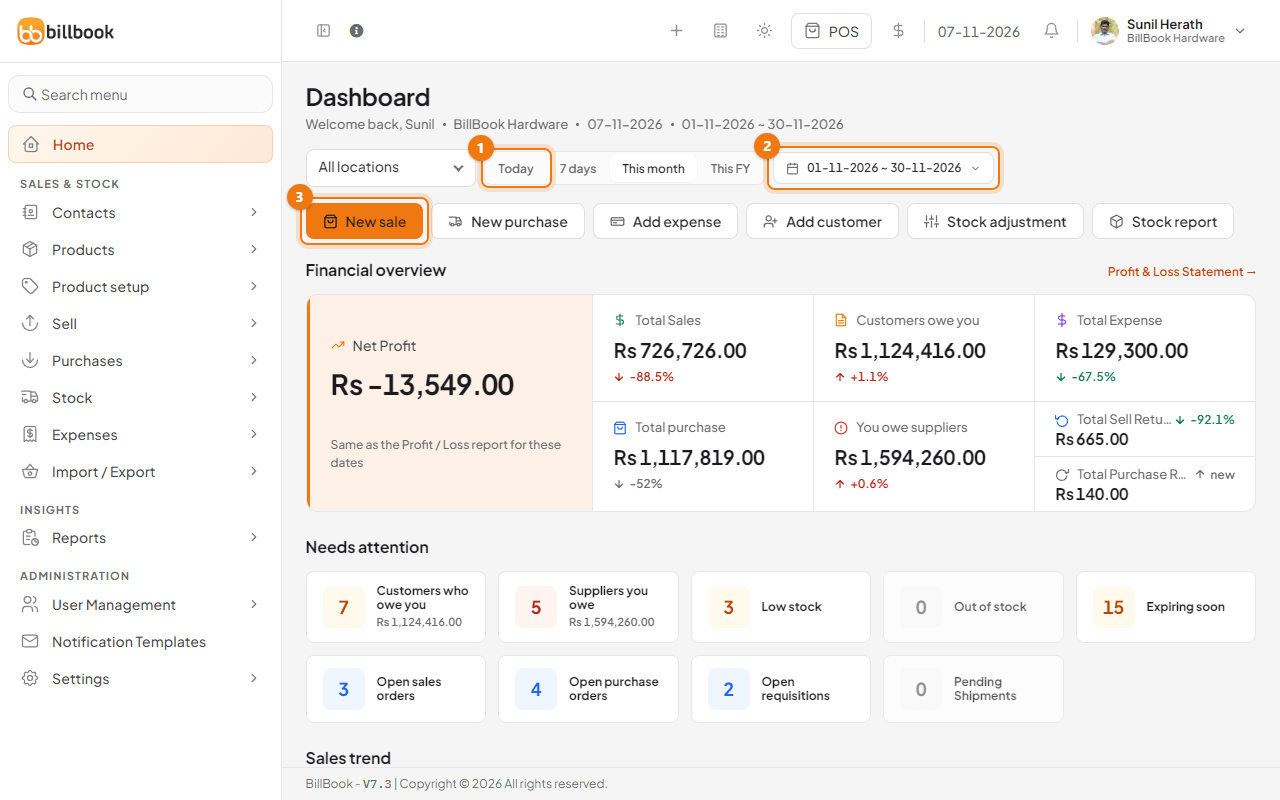
The cards and the Needs attention list follow the period you choose at the top of the page. The dashboard opens on Today. If nothing was sold, bought or spent today yet, it shows the last 7 days instead, so the cards are not empty. A period you pick yourself is remembered for next time.
- Select Today (1), 7 days, This month or This FY to switch the period. This FY is your financial year, which starts in the month you chose when you registered (April for most Sri Lankan businesses).
- To pick other dates, select the date range button (2). Choose a ready-made range such as Yesterday, Last 30 Days, Last Month or Last financial year, or choose Custom Range to enter your own dates and select Apply.
Note: If your business has more than one location, an All locations box appears to the left of the period buttons. Use it to see one location at a time. With one location the box is not shown. The pictures below use This month so the cards have numbers in them.
Quick actions#
The buttons under the period controls start a job at once: New sale (3), New purchase, Add expense, Add customer, Stock adjustment and Stock report.
Sales totals and chart#
Under Financial overview, Net Profit has a tile of its own, with the note that it is the same as the Profit & Loss Statement report for these dates. Next to it are Total Sales, Customers owe you, Total Expense, Total purchase, You owe suppliers, Total Sell Return and Total Purchase Return. A small arrow and percentage show the change compared with the period before. Select Profit & Loss Statement → to see the full report.
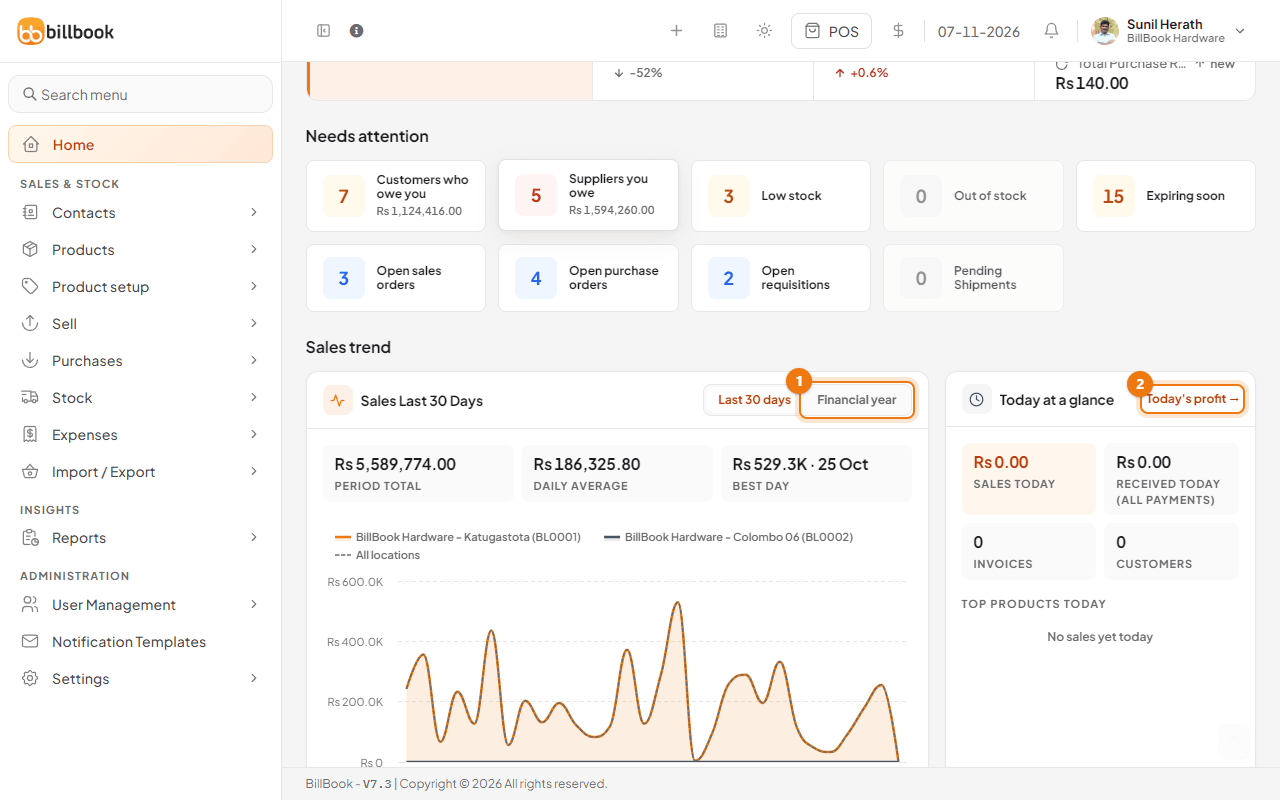
Further down, the Sales trend chart draws your sales day by day, with the Period total, Daily average and Best day above it.
- By default the chart shows Last 30 days.
- Select Financial year (1) to see sales for the whole financial year instead.
- Select Last 30 days to go back.
Note: The chart switch only changes the chart. The period buttons at the top do not change it.
Today snapshot#
The Today at a glance panel next to the chart shows Sales today, Received today (all payments), the number of invoices, the number of customers and your top products today. Received today counts every payment taken today, whatever the sale date. Select Today's profit → (2) to open today's profit report.
Needs attention list#
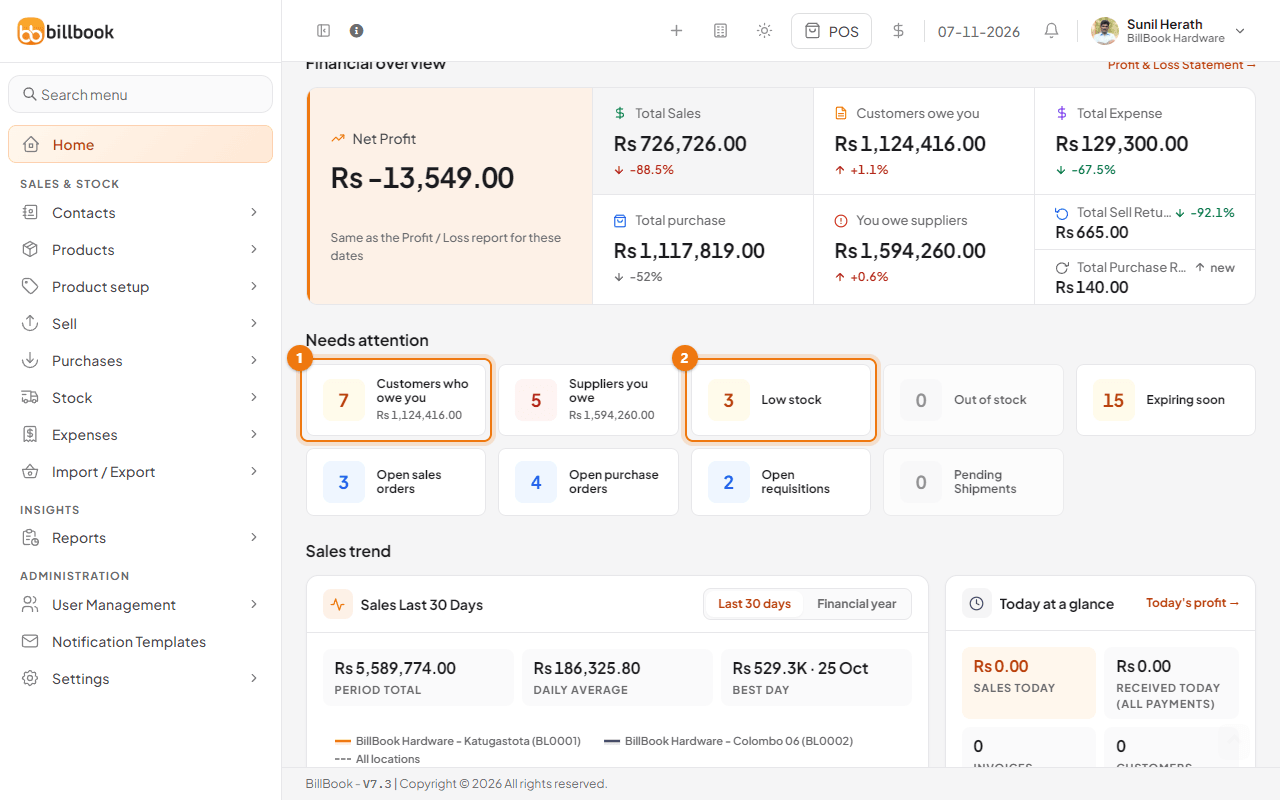
Needs attention is a grid of tiles for jobs waiting for you: Customers who owe you (1), Suppliers you owe, Low stock (2), Out of stock, Open sales orders, Open purchase orders, Open requisitions and Pending Shipments. With Enable Product Expiry on, an Expiring soon tile joins them. Each tile shows a count, and the first two also show the total amount. Select a tile to open the matching list. A tile with a count of 0 is greyed out.
Overview#
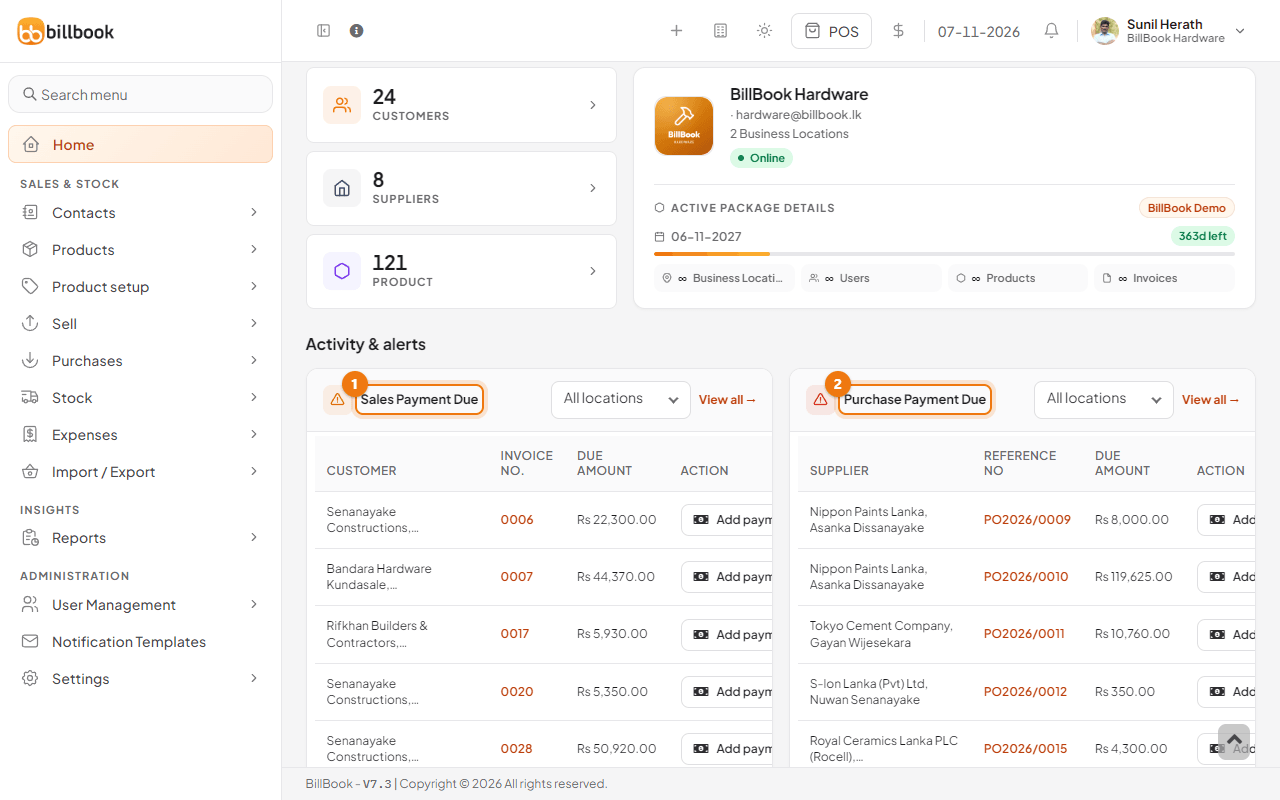
Under Overview, three cards count your Customers, Suppliers and Products. Select a card to open that list. Next to them, a card with your business name shows the number of locations, your plan under Active package details, the days left and your plan limits for locations, users, products and invoices.
Purchase and sales dues#
Under Activity & alerts, two tables show money that is waiting. The tables take a moment to fill after the page opens.
- Sales Payment Due (1) lists customers who still owe you, with the invoice number and the due amount.
- Purchase Payment Due (2) lists suppliers you still have to pay, with the reference number and the due amount.
- Select an invoice or reference number to open it, or View all → to see the full list. Use the page buttons under each table to move through the entries.
Stock alerts#
The Product Stock Alert (1) table lists products at or below their alert quantity, with the location, Current stock, Alert qty and a Status such as Low stock or Out of stock. Use it to decide what to reorder. Select View all → for the full list.
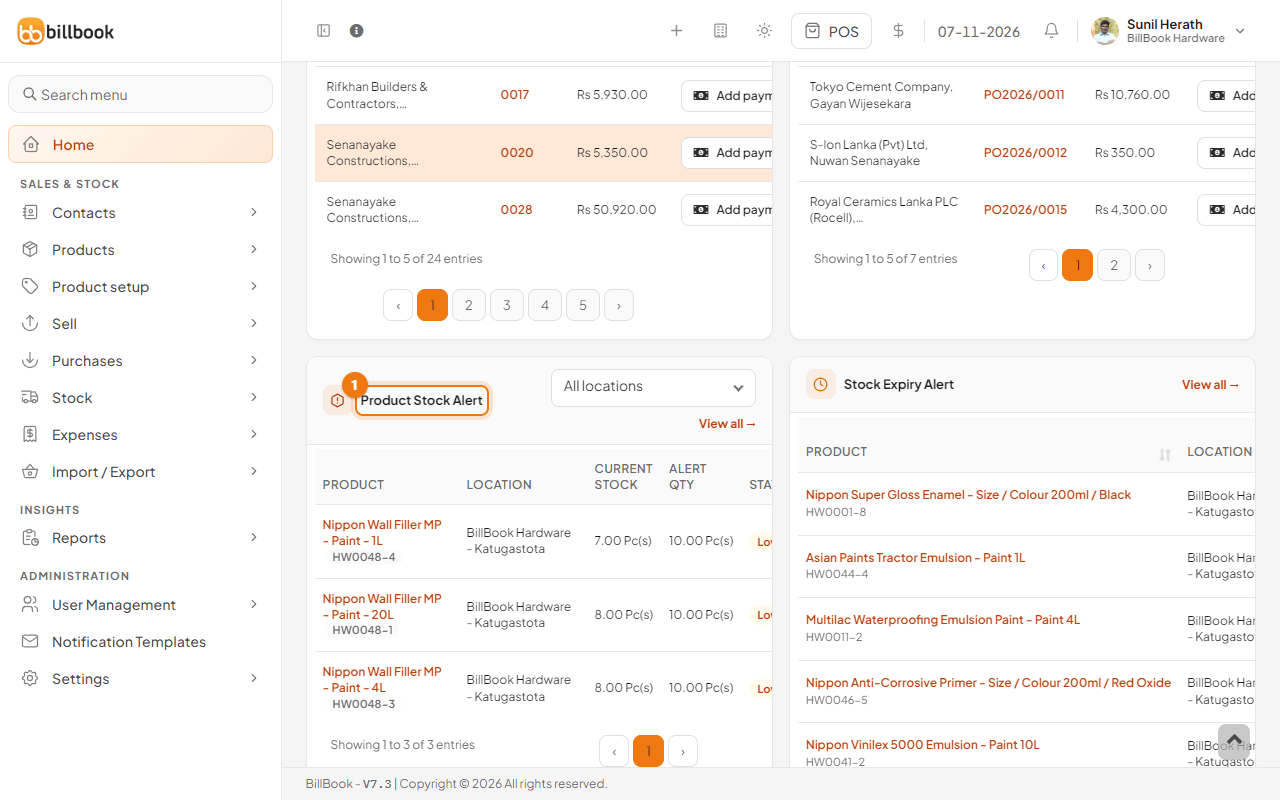
When expiry tracking is on, Stock Expiry Alert sits beside it and lists batches that are close to their expiry date. See Track expiry and lot numbers.
Below them, Orders & shipments shows Sales Order, Purchase Requisition, Purchase Order and Pending Shipments. Select the arrow at the right of a row to open it and see the entries, or View all → to open the full list.