
Stock reports
Last updated: 6 November 2026 · 5 min read
Stock reports tell you what you have, what it is worth and what needs attention before it is lost. Open them from Reports, under the Stock group.
Before you start: Lot Report and Stock Expiry Report only show when lot numbers and expiry dates are turned on for your business. Stock losses and corrections needs the Stock Adjustment module. See Track expiry and lot numbers for how to set these up.
Stock report#
Reports > Stock > Stock on hand lists every product with the quantity you hold at each location. The page is called Stock Balance & Valuation.
- Narrow the list with Business Location, Category, Sub category, Brand or Unit.
- Use Show (1) to focus on a problem, such as Low stock, Out of stock or items with no sale for a long time.
- The Low stock and Out of stock cards count products at or below their alert quantity and products with nothing left.
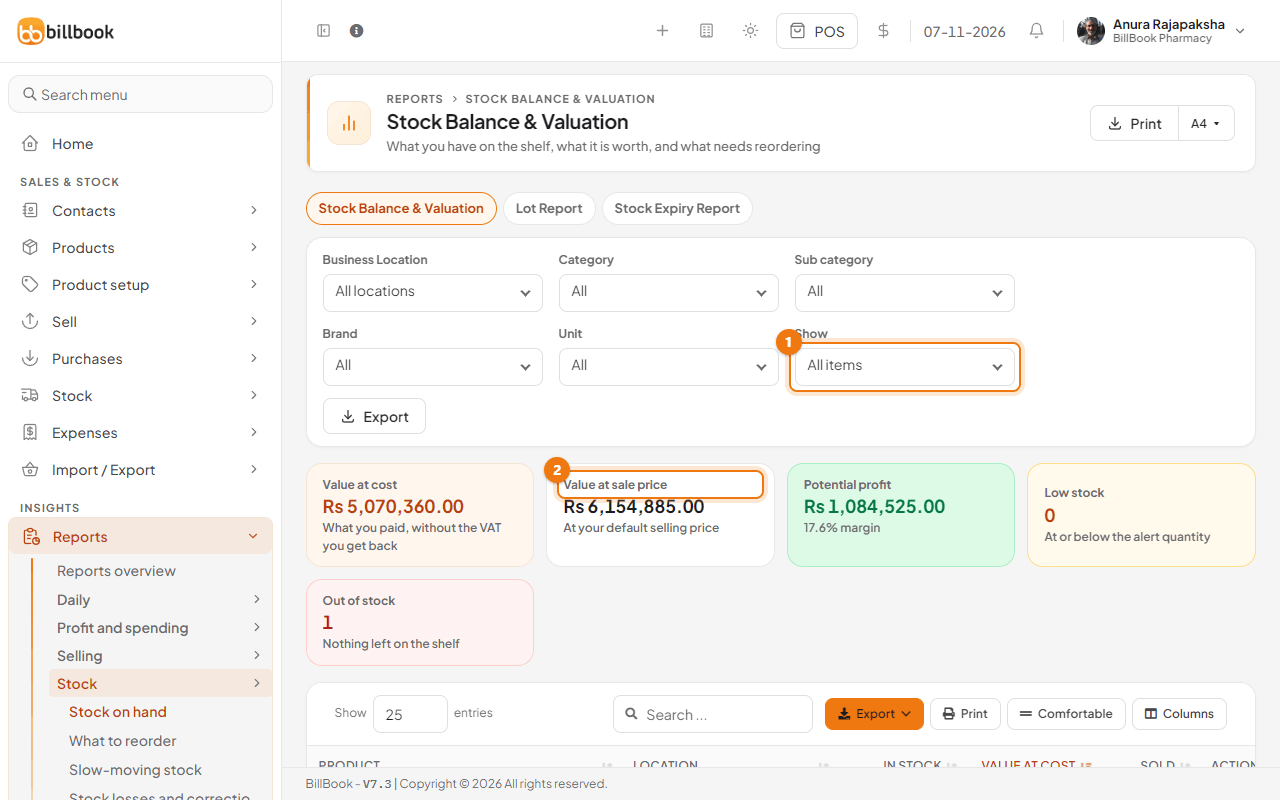
In the table, each product shows its location, the quantity in stock and its value. When lot numbers and expiry dates are on, two more tabs, Lot Report and Stock Expiry Report, appear above the filters.
Stock value by selling price#
The cards at the top of Stock on hand give three values for the stock you have now.
- Value at cost is what you paid for it, without the VAT you get back.
- Value at sale price (2) is what it would sell for at your default selling price.
- Potential profit is the difference, with the margin as a percentage.
Use these cards to see what your shelves are worth. Change the location or category filters to value one shop or one part of the range. The same cost figure is used on the Slow-moving stock and Lot Report pages and on the Balance Sheet.
What to reorder#
Reports > Stock > What to reorder lists items that are low, or selling faster than the stock lasts, grouped by the supplier you last bought them from.
- Choose a Supplier (1) to see only that supplier's items, or narrow by Business Location or Category.
- Set Sales history (2) to Only items sold in the last 90 days to leave out items that do not sell, then select Show.
- Read the cards: Items to reorder, Out of stock and the Estimated order cost at the last purchase price.
- In the table, each item shows what is In stock, what it Sold, last 30 days, its Days of cover, the Last cost, the suggested Order qty and the Order cost. Each supplier row shows the cost of its items.
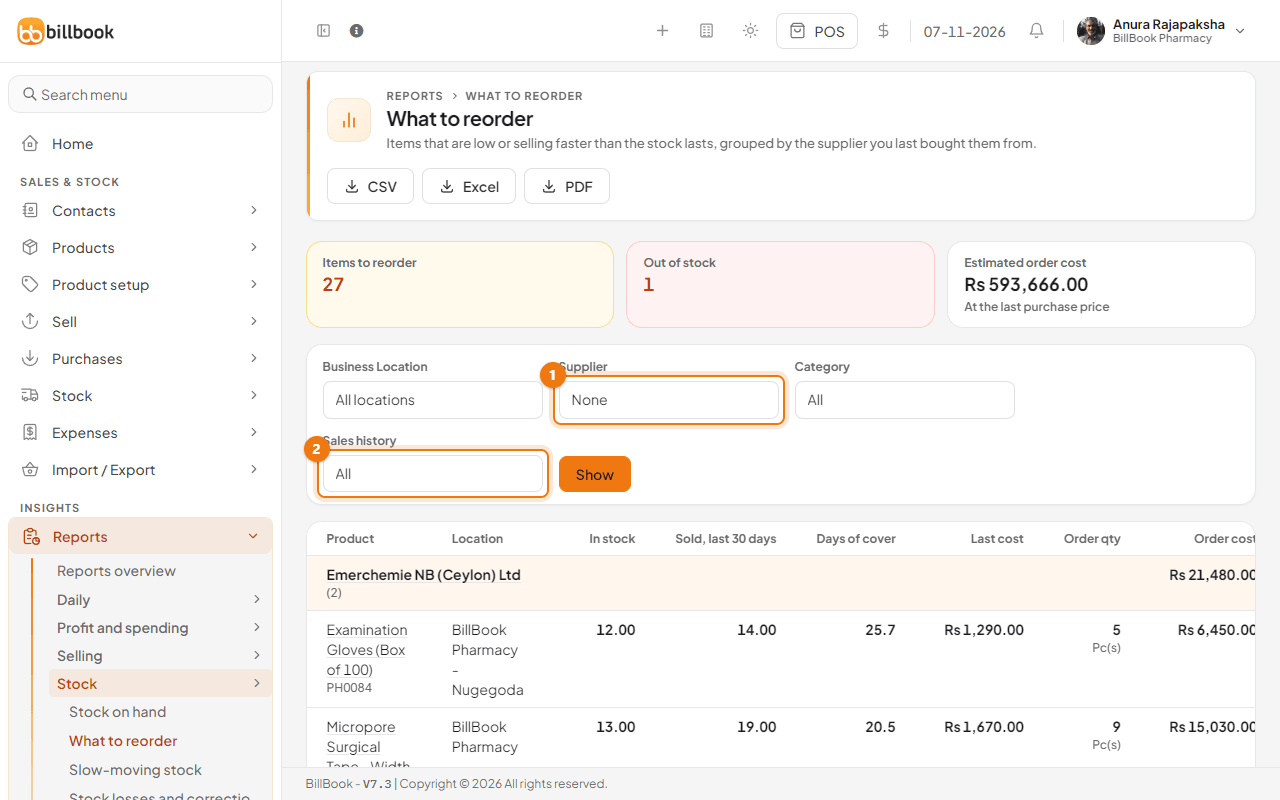
Use CSV, Excel or PDF at the top of the page to send the list to a supplier.
Slow-moving stock#
Reports > Stock > Slow-moving stock shows items on the shelf that have not sold for a while, and the cash tied up in them.
- Choose how long in Not sold for (1): 30 days, 60 days, 90 days or 180 days. You can also filter by Business Location, Category, Brand or Supplier. Select Show.
- Read the cards: Items flagged, Cash tied up (2), which is the cost of that stock, the same as on Stock on hand, and its Share of stock value.
- In the table, each item shows its stock, when it was Last sold, the Days since last sale, when it was Last received and the value tied up.
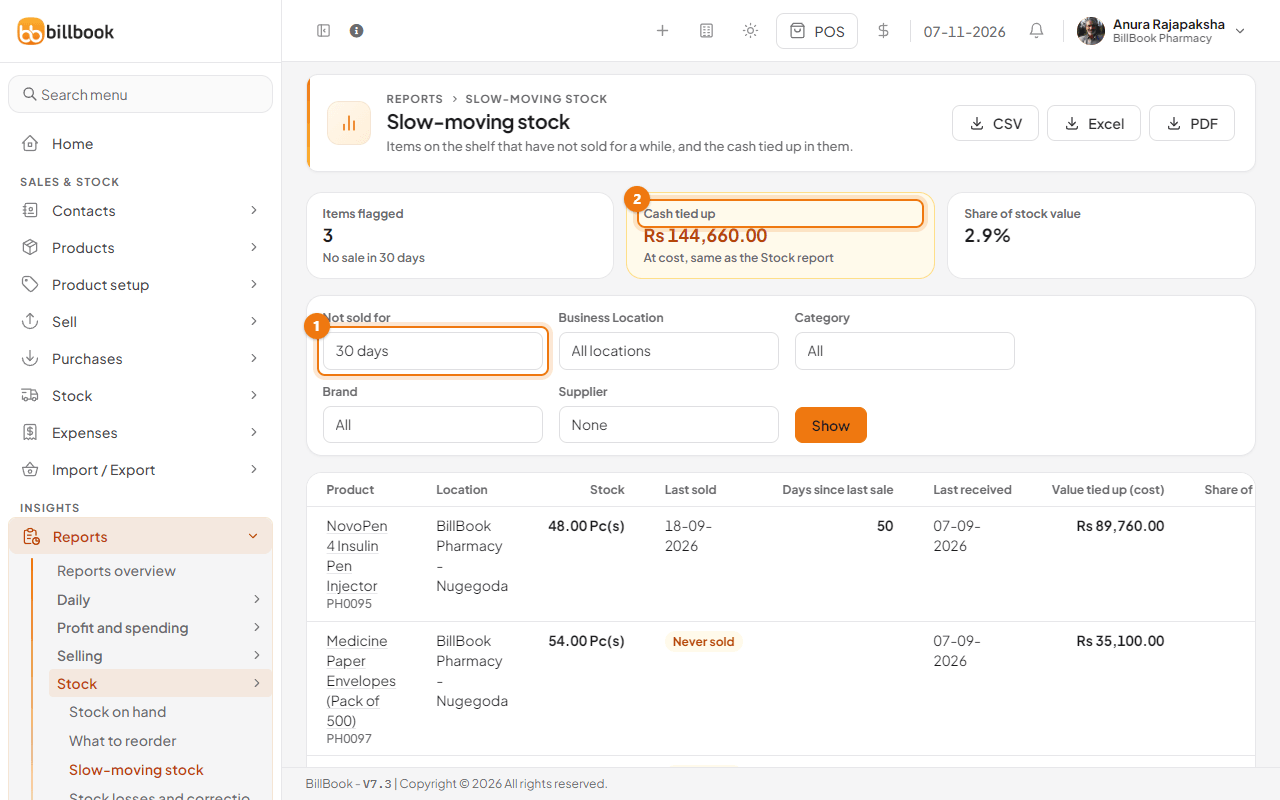
Note: Stock received within the period you chose is not counted, because it has not had time to sell.
Stock expiry#
Stock Expiry Report is a tab of Stock on hand. It shows stock that has expired or will expire soon.
- Select the Stock Expiry Report tab, then choose how far ahead to look in Show (1), for example Expired or Expires in 30 days.
- Read the cards: how many lots have Expired, expire in 7 days and in 30 days, and the Value at risk (2), which is stock that has expired or expires within 30 days, at cost.
- In the table, each row shows the product, Lot number, Exp date and the Stock left.
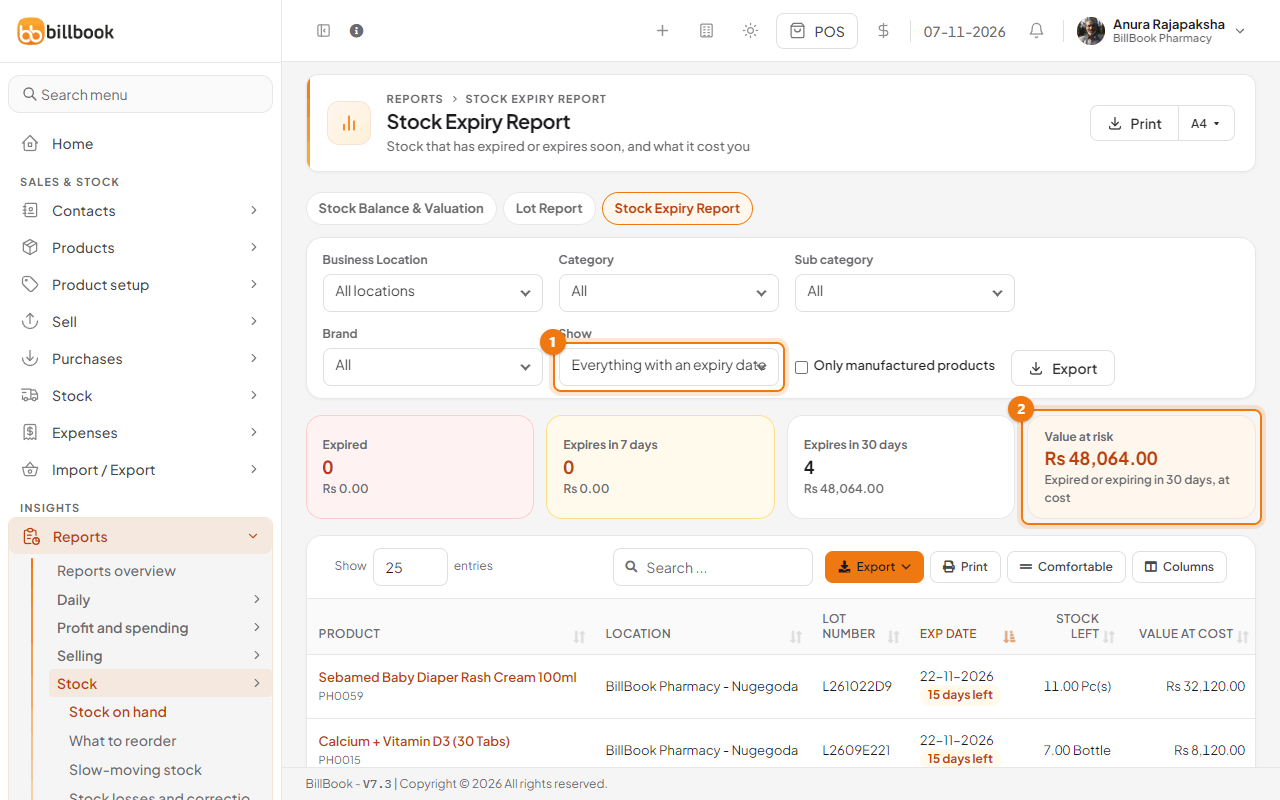
Tip: Check this report every week. Sell the stock that expires first, or discount it, before you have to write it off.
Lot report#
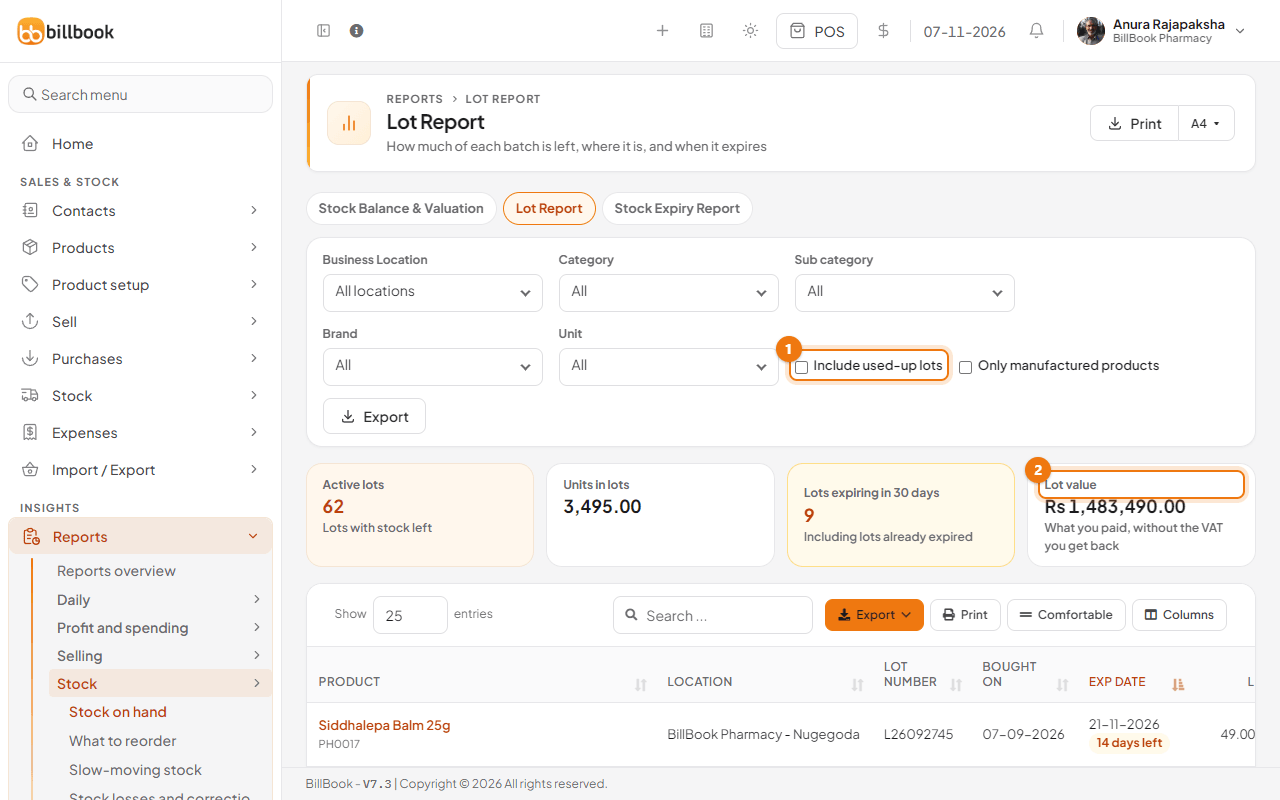
Lot Report is the other tab of Stock on hand. It shows how much of each batch is left.
- Tick Include used-up lots (1) if you also want lots with nothing left.
- Read the cards: Active lots (lots with stock left), Units in lots, Lots expiring in 30 days and Lot value (2), which is what you paid, without the VAT you get back.
- In the table, each lot shows its product, location, lot number, the date it was bought, its expiry date, the quantity left and the value at cost.
Stock adjustment report#
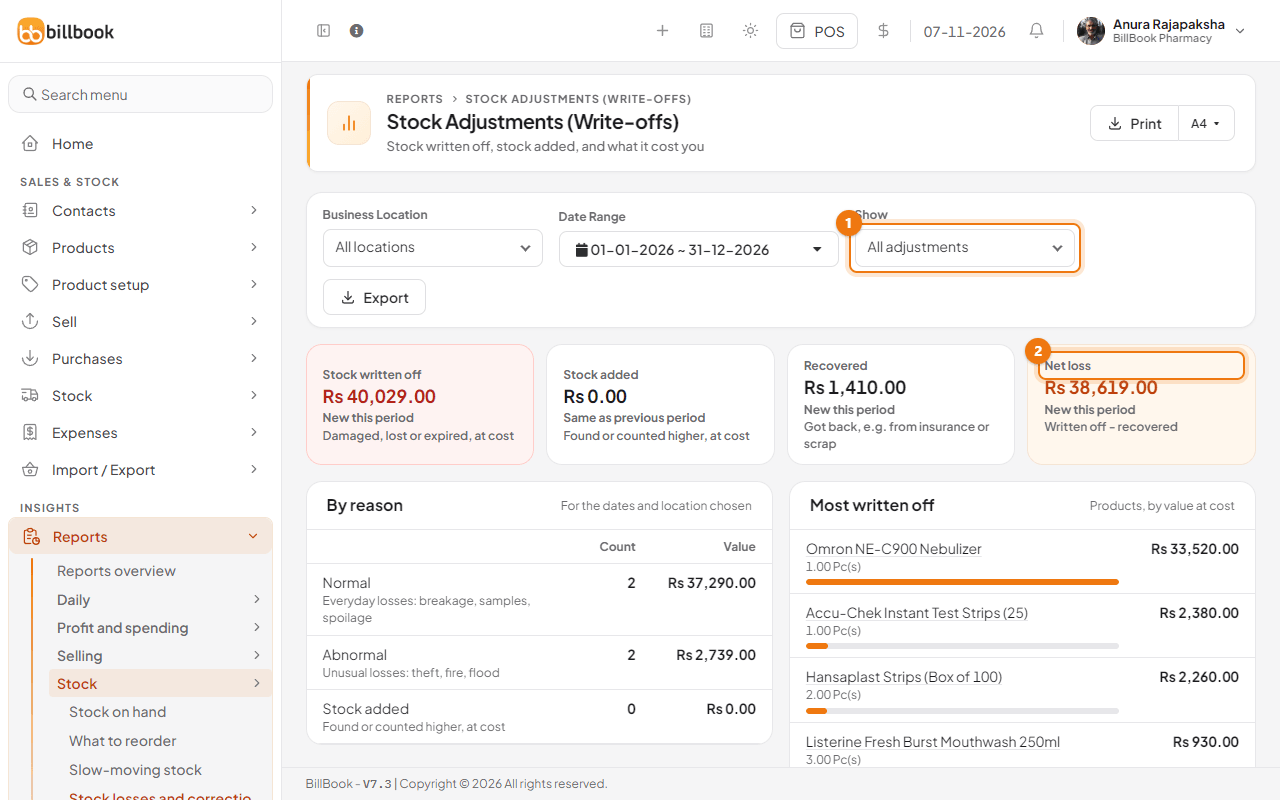
Reports > Stock > Stock losses and corrections shows stock you wrote off or added, and what it cost you. The page is called Stock Adjustments (Write-offs).
- Choose the Date Range. Use Show (1) to see All adjustments, Stock written off, Normal, Abnormal or Stock added.
- Read the cards: Stock written off (damaged, lost or expired, at cost), Stock added (found or counted higher), Recovered (got back, for example from insurance or scrap) and Net loss (2), which is the amount written off less what you recovered.
- The By reason table splits the count and value into Normal losses (breakage, samples, spoilage) and Abnormal losses (theft, fire, flood). Most written off lists the products that cost you most.
Write-offs also reduce your profit. They appear in the Profit & Loss Statement as Stock written off (adjustments).