BillBook offers comprehensive reports to help businesses analyze sales, purchases, stock, expenses, and overall financial performance. 🚀📑
📌 How to Access Reports in BillBook? #
✅ Go to → Reports
✅ Select the specific report category you want to view.
✅ Use available filters (date range, business location, category, etc.) for better insights.
📌 Some reports come with advanced filters to help analyze business data efficiently.
📋 List of Available Reports in BillBook #
1️⃣ Purchase & Sale Report #
- Tracks total purchases & sales 📊
- Includes purchase & sales taxes
- Shows outstanding dues for purchases & sales
2️⃣ Tax Reports #
- Displays Input Tax (on purchases) & Output Tax (on sales)
- Helps in tax calculations & compliance ✅
3️⃣ Contacts Report (Customers & Suppliers) #
- Shows purchase & sale details for each contact
- Displays outstanding dues for customers & suppliers
- Positive due amount → Money received from contact
- Negative due amount → Money to be paid to contact
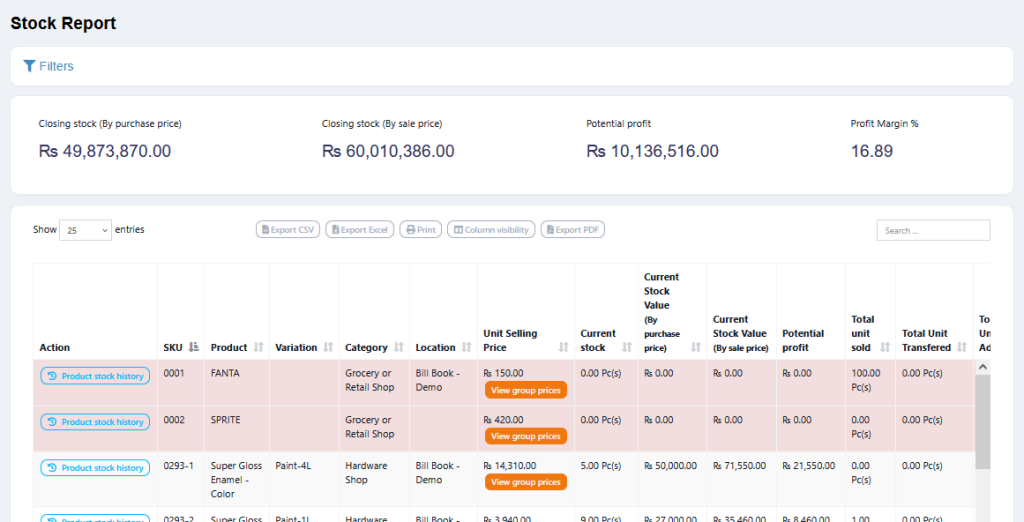
4️⃣ Stock Report #
- Shows current stock levels 📦
- Tracks total sold quantity
- View product variations (click the Green Plus button for variable products)
📌 Stock Value Reports:
✅ Stock Value by Purchase Price – Total value of stock based on purchase cost.
✅ Stock Value by Sales Price – Total value of stock based on selling price.
📌 Datewise Stock Tracking:
✅ Go to Stock Report → Product Stock History
5️⃣ Trending Products Report #
- Identifies most in-demand products 🔥
- Apply filters by Business Location, Category, Brand, Date Range
- View Top 5, Top 10, or any number of trending products
6️⃣ Expense Report #
- Tracks total business expenses 💰
- Filter by Business Location & Expense Categories
7️⃣ Register Report #
- Shows details of all cash registers 🏦
- Filter by User & Status (Open or Closed)
8️⃣ Sales Representative Report #
- View sales & expenses details per sales rep
- Filter by User, Business Location, Date Range
9️⃣ Grouping Invoices in Product Sell Report #
✅ Go to → Reports → Product Sell Report → Click “Grouped” Tab
✅ Invoices are grouped by Date & Product Name.
📌 Example:
- All Butter Cookies sold today will be shown in one row.
- Butter Cookies sold yesterday will be shown in another row.
- Helps in tracking product-wise sales efficiently.
🚀 Why Use BillBook’s Reports? #
✅ Provides real-time insights into business performance 📊
✅ Helps in tax calculations & compliance ✅
✅ Tracks stock levels, expenses & customer dues 📦💰
✅ Identifies top-selling products & trends 🔥
With BillBook’s Reports feature, businesses can make informed decisions & optimize their operations effortlessly! 🚀📑
Let me know if you need any refinements! 😊